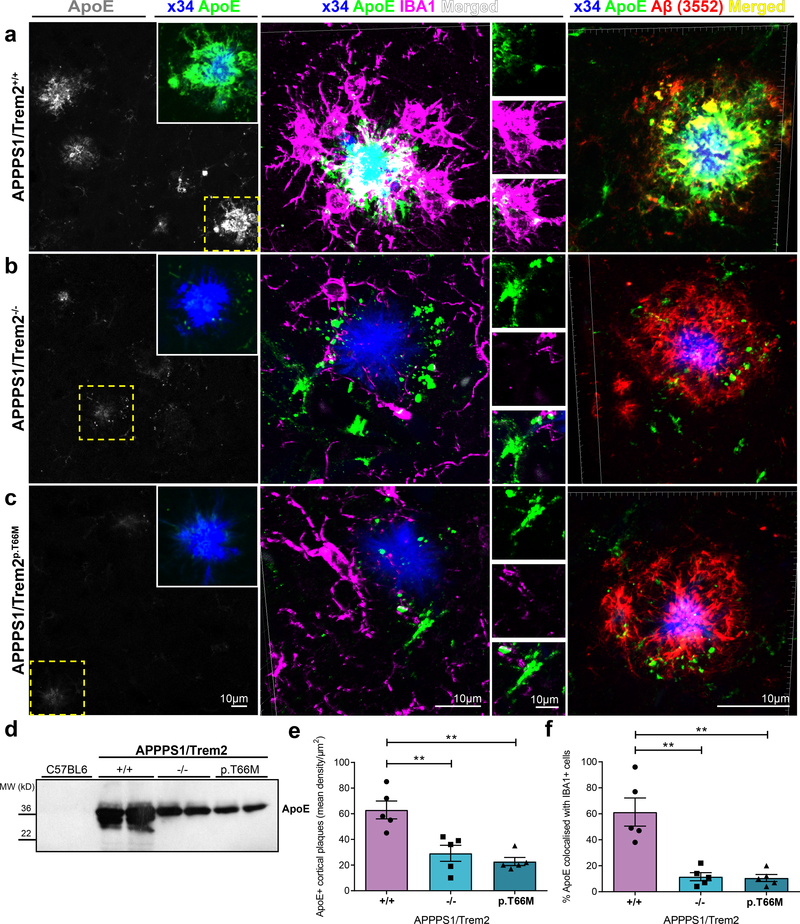
Figure 6. Decreased ApoE in non-experimentally seeded cortical Aβ plaques after loss of Trem2 function.
(a) Left: ApoE (gray) staining of non-experimentally seeded cortical Aβ plaques of APPPS1/Trem2+/+ mice. Inset demonstrates a higher magnification of ApoE (green) colocalised with x34-positive cortical plaque (blue) in the same area shown in yellow dotted box. Middle: High-resolution confocal images of x34/ApoE/IBA1 stained cortical amyloid plaque in APPPS1/Trem2+/+ were 3D reconstructed. Selected areas of each staining (top - ApoE in green, middle - IBA1 in magenta, bottom - merged in white) are shown adjacently. Right: 3D reconstructed high-resolution confocal images of x34/ApoE/Aβ (3552) stained amyloid plaque in APPPS1/Trem2+/+ cortex. Immunopositive Aβ (red) and ApoE (green) are strongly colocalised (yellow). (b) Left: Reduced ApoE staining (gray) in cortical amyloid plaques of APPPS1/Trem2−/− mice and (C, left) APPPS1/Trem2p.T66M mice. Dotted cyan box indicates the area that is magnified as inset (ApoE – green, x34 – blue). Middle: 3D reconstructed images of x34/ApoE/IBA1 show reduced IBA1 and ApoE colocalisation in APPPS1/Trem2−/− mice and (c, middle) APPPS1/Trem2p.T66M mice. Right: 3D reconstructed images of x34/ApoE/Aβ (3552) stained amyloid plaque in APPPS1/Trem2−/− and APPPS1/Trem2p.T66M cortex show very little to no colocalisation between ApoE (green) and immunopositive-Aβ (red). (d) Immunoblotting with the anti-ApoE antibody HJ6.3 shows decreased cortical ApoE in the formic acid fraction of seeded APPPS1/Trem2−/− and APPPS1/Trem2p.T66M as compared to APPPS1/Trem2+/+ mice. Western blots were independently repeated four times to analyze at least n=8 mice/genotype. Full image of immunoblots are shown in Supplementary Fig. 7. (e) Quantification of ApoE density in cortex (n=5 mice/genotype; F2,12=14.31, p=0.0007). (f) Quantification of ApoE colocalisation in IBA1-positive microglia in APPPS1/Trem2+/+, APPPS1/Trem2−/− and APPPS1/Trem2p.T66M mice (n=5 mice/genotype; F2,12=18.82, p=0.0002). Data represent mean ± SEM. One-way ANOVA, Dunnett’s post hoc analysis; **p<0.005.

