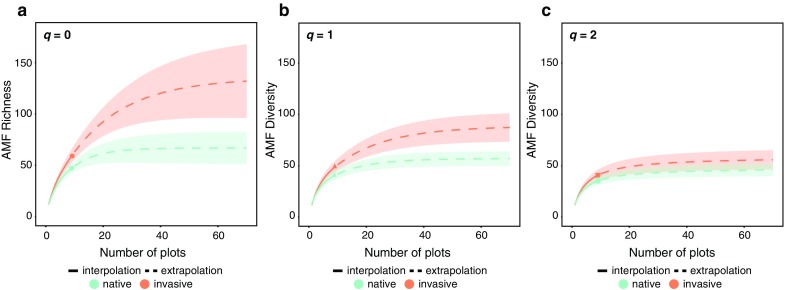
Fig. 2.

Sample-size- rarefaction and extrapolation sampling curves with confidence intervals for the plots with native (green) and invasive (red) dominant vegetation, according to the Hill numbers which includes species richness (a), Shannon diversity (the exponential of Shannon entropy, b), and Simpson diversity (the inverse Simpson concentration, c)
