Figure 1.
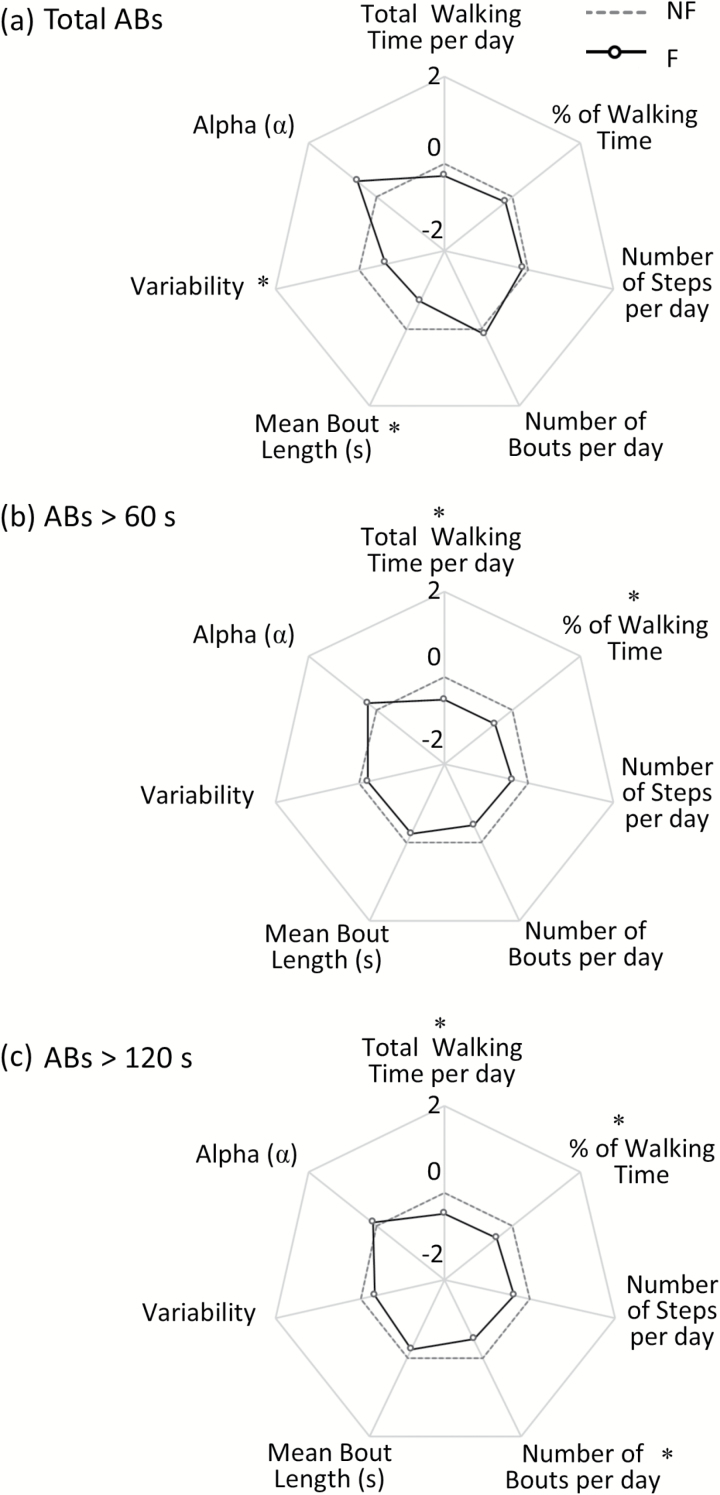
Radar plot illustrating the free-living Macro gait characteristics for Fallers (F), compared to Non Fallers (NF), evaluated in free-living conditions for total ambulatory bouts (ABs > three steps, panel a), ABs > 60 s (panel b), and ABs > 120 s (panel c). The central dotted line represents NF data, deviation from zero along the axis radiating from the center of the plot represents how many standard deviations the F differ from NF (range: ± 2 SD, z score based on NF means and SD). * represents significant differences between F and NF (effect of Fall History) (p values < .05).

