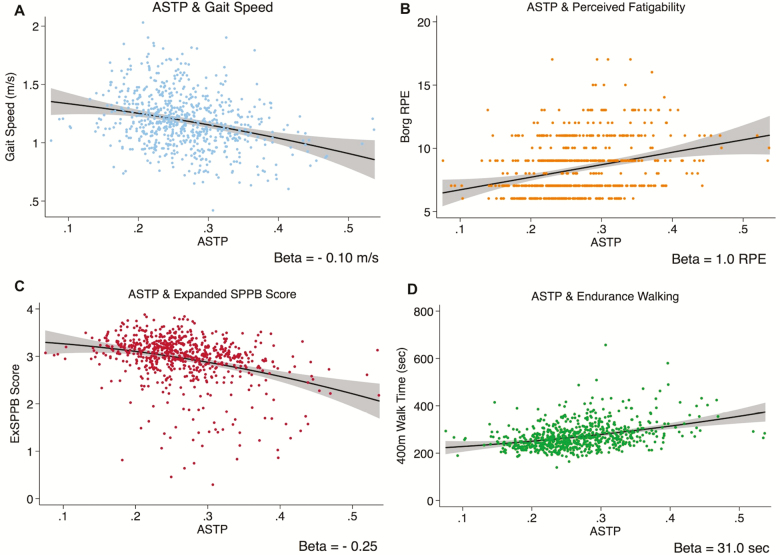
Figure 2.
Scatterplots, fitted lines, and 95% confidence interval depicting the univariate association between Active-to-Sedentary Transition Probability (ATSP) and (A) usual gait speed (meters per second), (B) perceived fatigability (Borg rating of perceived exertion [RPE]), (C) expanded short physical performance battery score, and (D) time to walk 400 m (seconds; p < .001 for all).

