. 2018 Dec 26;8(2):246–261. doi: 10.1039/c8tx00267c

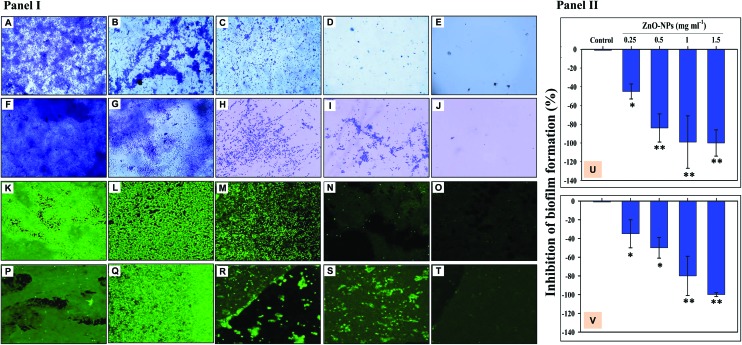
Fig. 6. Inhibition of biofilm formation by ZnONP treated bacterial isolates (Panel I). Micrographs A–E represent the biofilm formed on the glass surface; untreated K. pneumoniae biofilm (A), K. pneumoniae + 0.25 mg ml–1 ZnONPs (B), K. pneumoniae + 0.5 mg ml–1 ZnONPs (C), K. pneumoniae + 1 mg ml–1 ZnONPs (D), and K. pneumoniae + 1.5 mg ml–1 ZnONPs (E). Images F–J represent the biofilm of S. aureus formed on the glass surface; untreated S. aureus biofilm (A), S. aureus + 0.25 mg ml–1 ZnONPs (B), S. aureus + 0.5 mg ml–1 ZnONPs (C), S. aureus + 1 mg ml–1 ZnONPs (D), and S. aureus + 1.5 mg ml–1 ZnONPs (E). CLSM analysis of the bacterial biofilm: images K–O represent the biofilm formed by K. pneumoniae on the glass surface; untreated K. pneumoniae biofilm (A), K. pneumoniae + 0.25 mg ml–1 ZnONPs (B), K. pneumoniae + 0.5 mg ml–1 ZnONPs (C), K. pneumoniae + 1 mg ml–1 ZnONPs (D), and K. pneumoniae + 1.5 mg ml–1 ZnONPs (E). Images P–T represent the biofilm formed by S. aureus on the glass surface; untreated S. aureus biofilm (A), S. aureus + 0.25 mg ml–1 ZnONPs (B), S. aureus + 0.5 mg ml–1 ZnONPs (C), S. aureus + 1 mg ml–1 ZnONPs (D), and S. aureus + 1.5 mg ml–1 ZnONPs (E). Bar diagrams in panel II show the percent inhibition in the biofilm formation of K. pneumoniae (U) and S. aureus (V) under ZnONP stress (0.25–1.5 mg ml–1). The bars represent the mean values of three independent replicates ± SD (*p ≤ 0.05, **p ≤ 0.005 vs. control).

Fig. 6