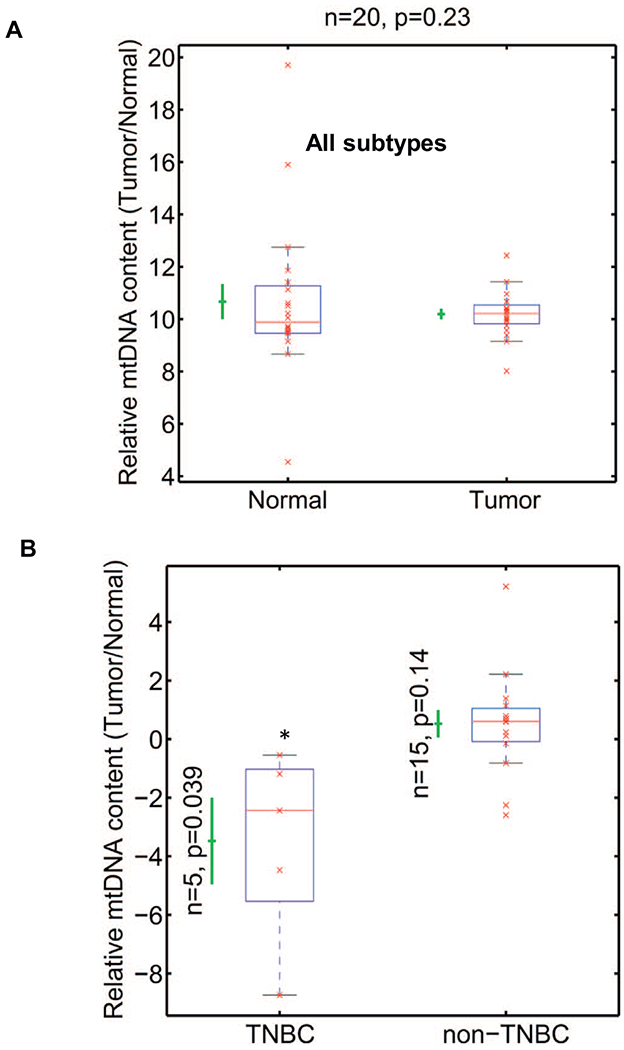
Fig. 2.

mtDNA content in human breast tumors.
(A) Real time PCR showing relative mtDNA levels in breast tumor tissues (n = 20) and matched non-tumor tissues (n = 20). The mtDNA content (y-axis) is quantified as the copy number of mtDNA gene CcO1, normalized by copy number of nuclear single copy gene CcOIVi1, plotted in log2 scale. P = .23 (B) Relative mtDNA content (y-axis) is the ratio of mtDNA contents of tumor and matched normal tissues in TNBC (n = 5; p < .039) and non-TNBC (n = 14, p = .14) plotted in Log2 scale. Statistical analysis was done using one-tail paired Student’s t-test. All p-values were calculated in the original −log2 scale, assuming two Gaussian distributions with different means, variances and different numbers of samples. P values are indicated in the figure. * indicates p < .05.
