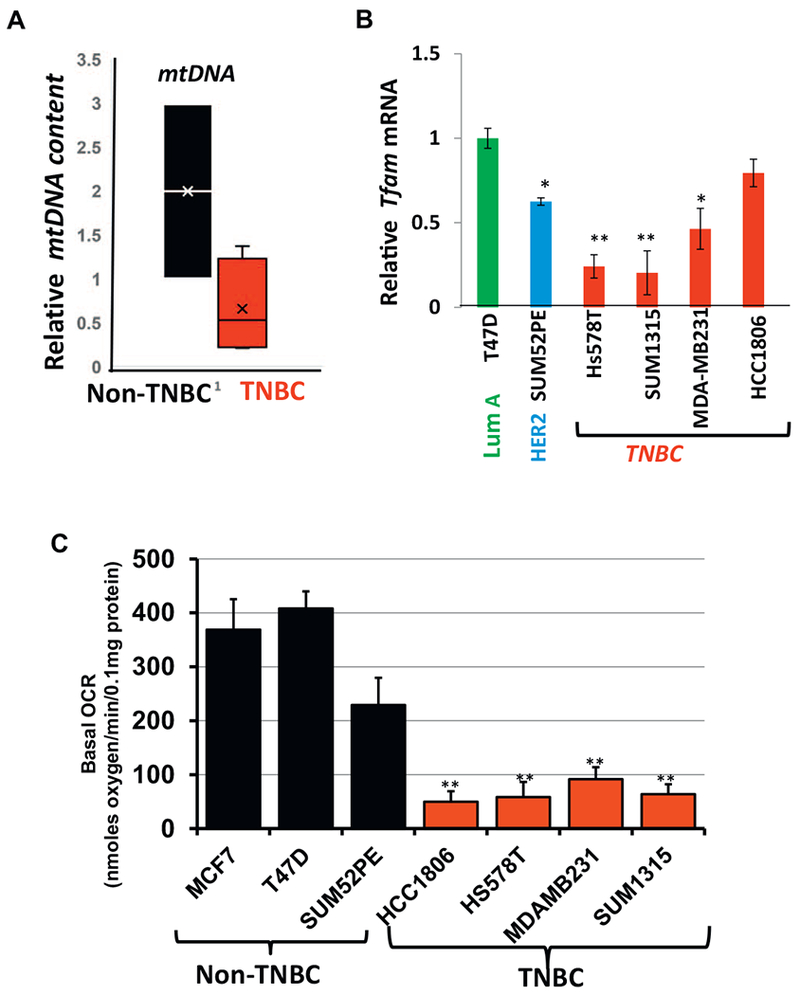
Fig. 3.

Mitochondrial functional defects in breast cancer cell lines.
(A) Relative mtDNA content in non-TNBC and TNBC cells. Box plot showing the distribution of the relative mtDNA content in TNBC and non-TNBC cells normalized to internal single gene CcOIVi1. The line inside each box indicates the mean. (B) Relative Tfam mRNA in TNBC (Hs578T, SUM1315, MDA-MB231, HCC1806) and non-TNBC (T47D, SUM52PE) cell lines. 20 ng of cDNA was used per reaction for real time PCR amplification using either Tfam or endogenous gene RPL13A. (C) Basal cellular oxygen consumption rate (OCR) in the cell lines (5 × 10⁴ cells per well) as indicated in the figure measured using an XF24 analyzer. All experiments were done in triplicates and mean ± SEM are plotted. Statistical analysis for significance was done using Students t-test. Data is significant at p < .05.
