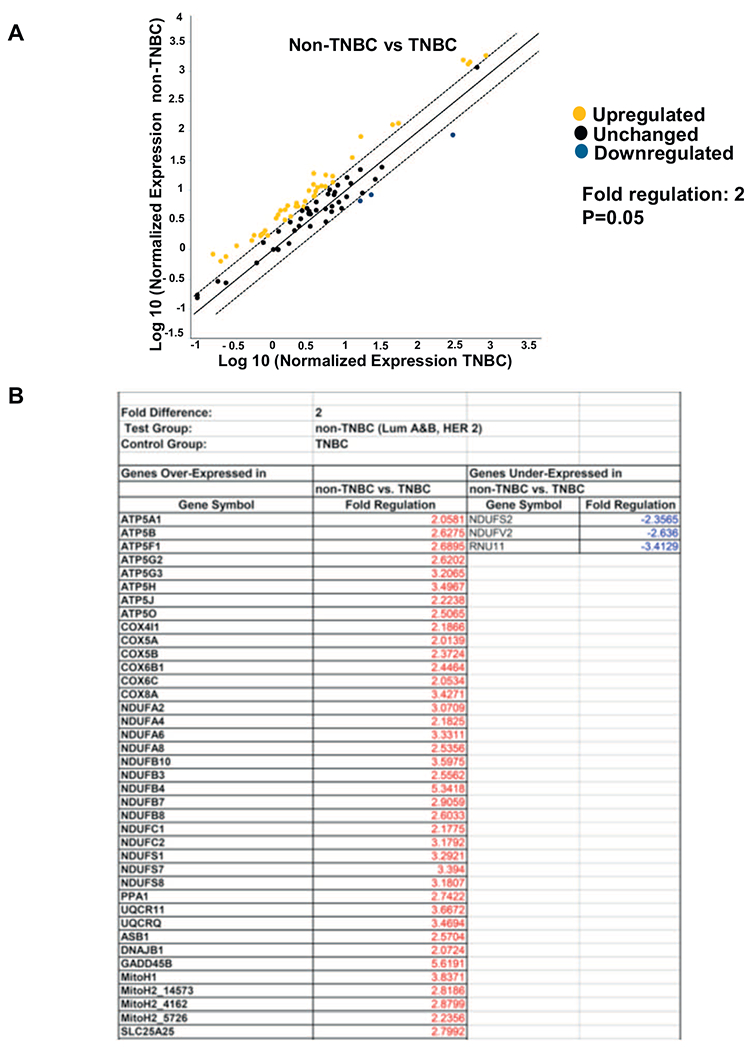
Fig. 5.

RT2 profiler array showing changes in mitochondrial metabolism genes in TNBC compared to non-TNBCs. Four non-TNBCs and two TNBCs were analyzed for the profiler array and run in duplicate. (A) Scatter plot showing distribution of the genes involved in the mitochondrial metabolism pathway compared between non-TNBC (Luminal A, Luminal B and HER2+) and TNBC (control group). Black dots indicate unchanged genes, yellow dots indicate genes activated non-TNBC. Fold-regulation represents fold-change results in a biologically relevant way. Fold-change values greater than one indicate a positive- or an up-regulation. The p value is calculated based on a Student’s t-test of the replicate 2^(−Delta Ct) values for each gene in the TNBC (control) group and non-TNBC groups. The fold change has significant difference at p value < .05.
