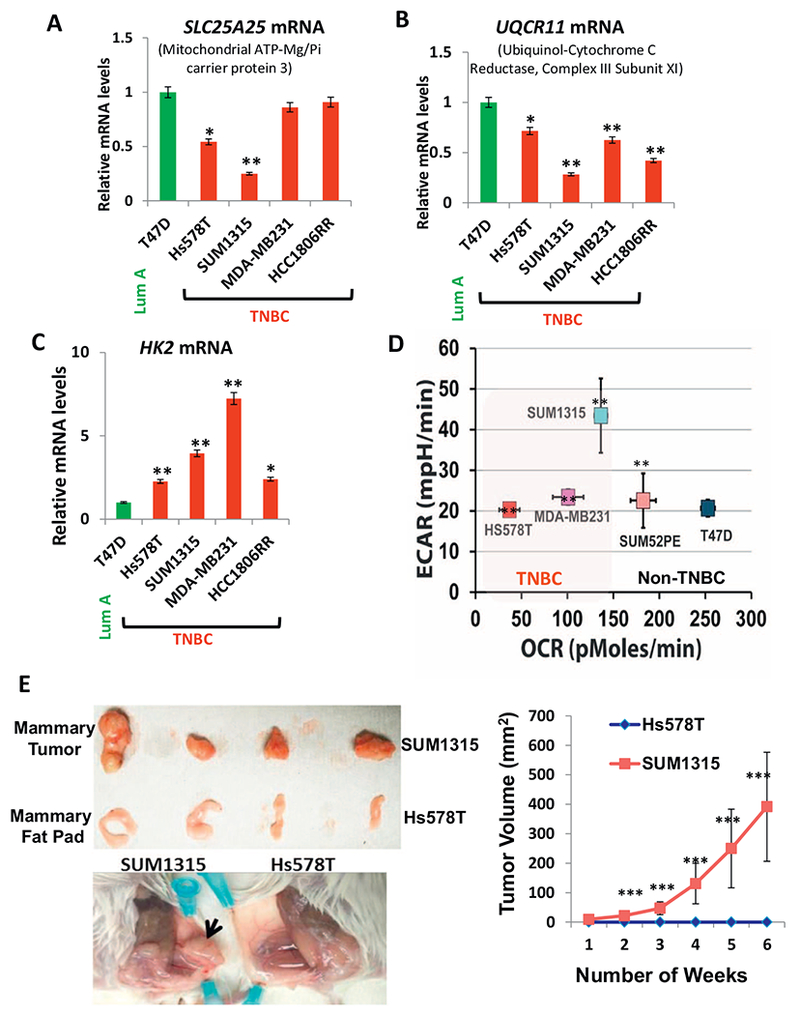
Fig. 6.

OXPHOS modulation among the breast tumor subtypes.
(A, B) Real time PCR showing alterations In genes encoding mitochondrial proteins, SLC25A25 and UQCR11 (as indicated in the figure) in TNBC cells compared to non-TNBC T47D cell line. (C) Real time PCR showing altered mRNA levels of glycolytic gene hexokinase 2 in TNBC cells compared to non-TNBC T47D cell line. (D) Extracellular acidification rate (ECAR) versus the OCR in the cell lines (5 × 10⁴ cells per well) indicated in the figure. All experiments were done in triplicates and mean ± SEM are plotted. (E) Left panel: (Top) Representative xenograft tumors in 6 week old female NSG™ mice (n = 4 each category) derived from SUM1315 cells and mammary fat pad (MFP) of mice injected with Hs578T as indicated in the figure. (Below) Representative picture of the mouse mammary fat pad showing xenograft tumors formed from SUM1315 cells and no tumor formation by Hs578Tcells. Right panel: Graph showing tumor volume measured over six weeks. Statistical analysis for significance of differences was done using Students t-test. * indicates significance level at p < .05, ** = p < .01 and *** = p < .001.
