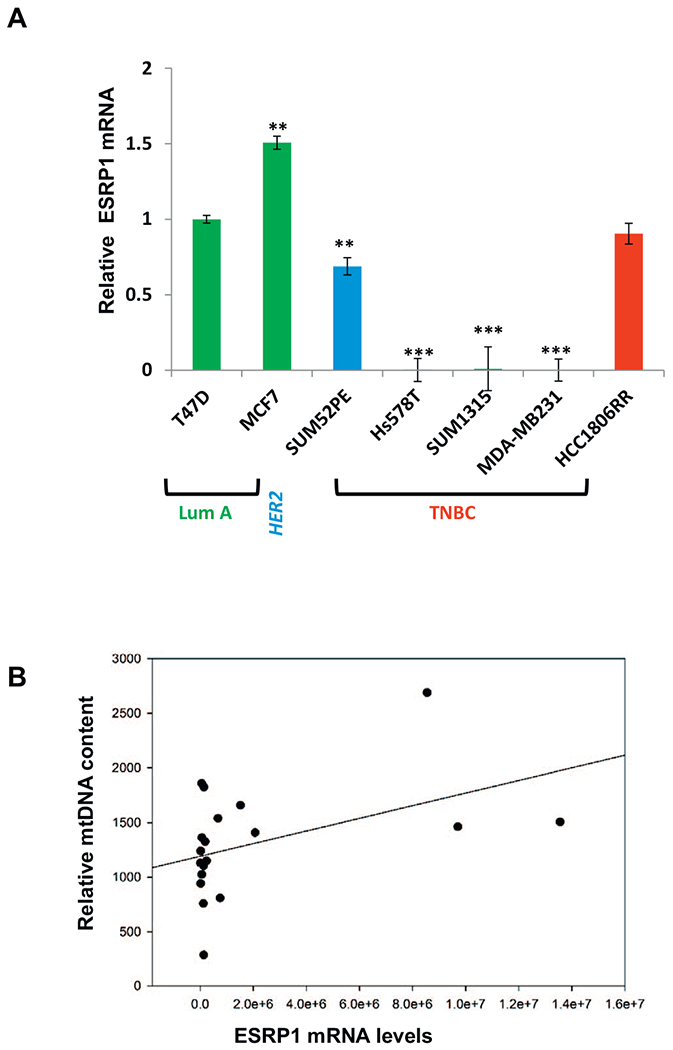
Fig. 7.

Relative levels of ESRP1 among the breast tumor subtypes.
(A) Relative levels of ESRP1 in TNBC cells (as indicated in the figure) compared to non-TNBC T47D cells analyzed by real time PCR using ESRP1 specific Taqman primer-probe pairs. 18S Taqman primer-probe pair was used as an internal control for normalization. Statistical analysis for significance of differences was done using Students t-test. * indicates p < .05, ** indicates p < .01. (B) Correlation plot for relative mtDNA (mtDNA encoded cytochrome oxidase subunit 1 Cco1) and ESRP1 levels in the tumors (n = 22). Pearson (linear) and Spearman (rank) methods were used to identify tumors containing low mtDNA content as well as low ESRP1.
