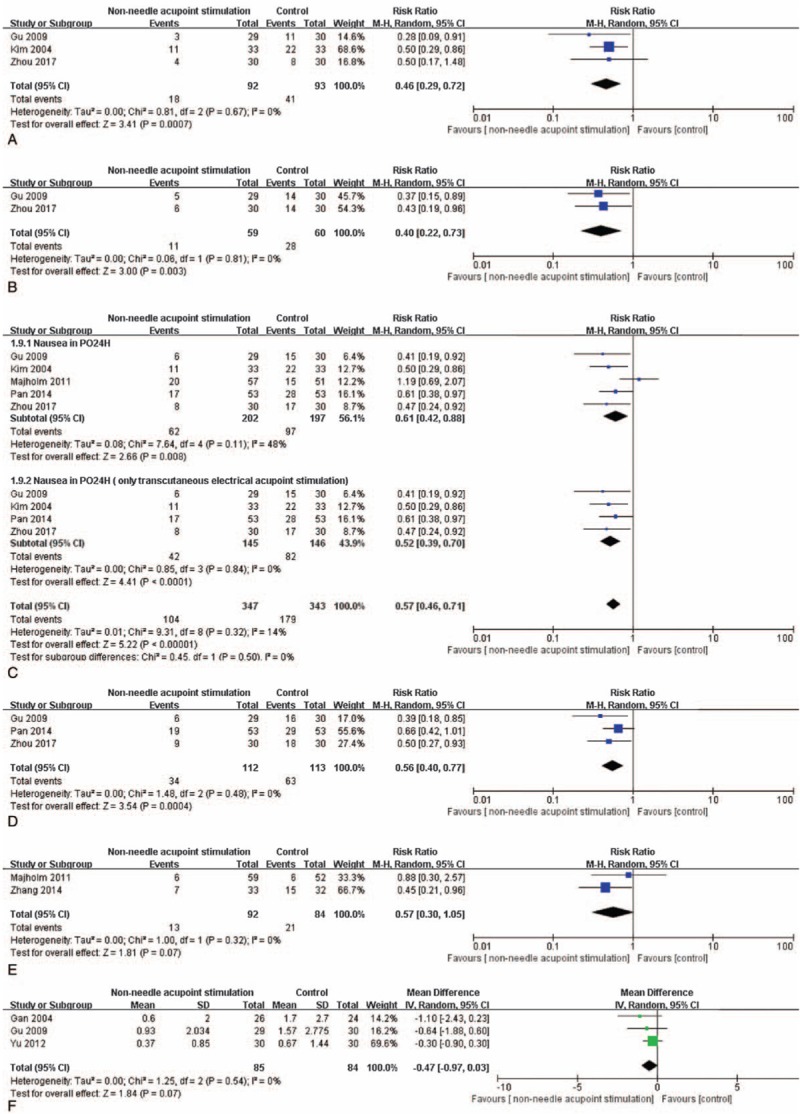
Figure 4.

The forest plots indicate the differences in nausea within PO6H (A), nausea within PO12H (B), nausea within PO24H (C), nausea within PO48H (D), and nausea in the recovery room (E).

The forest plots indicate the differences in nausea within PO6H (A), nausea within PO12H (B), nausea within PO24H (C), nausea within PO48H (D), and nausea in the recovery room (E).