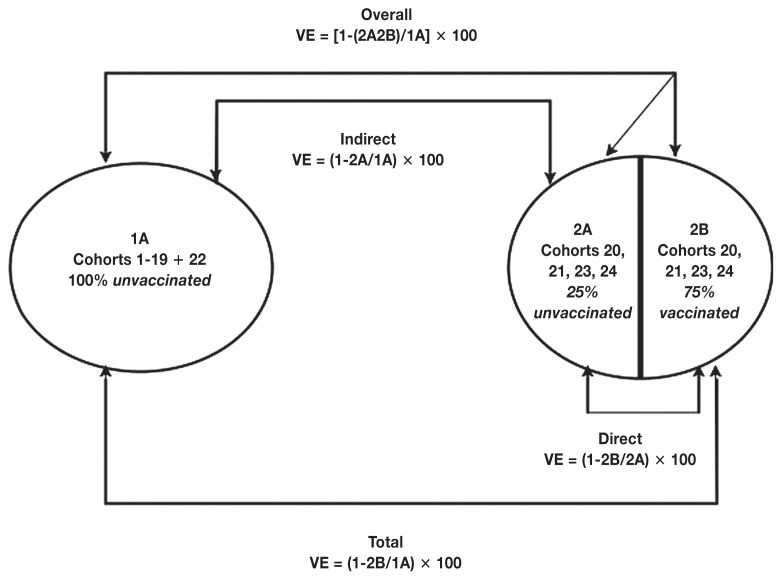
Figure 2.
Vaccine effectiveness (VE) as described by Halloran et al (8) where “1” is before the introduction of the vaccine into the population of piglets and “2” is after the introduction of the vaccine into the population. The full calculations for VE are listed and can also be interpreted as 1-RR (relative risk) for each measure of VE.

