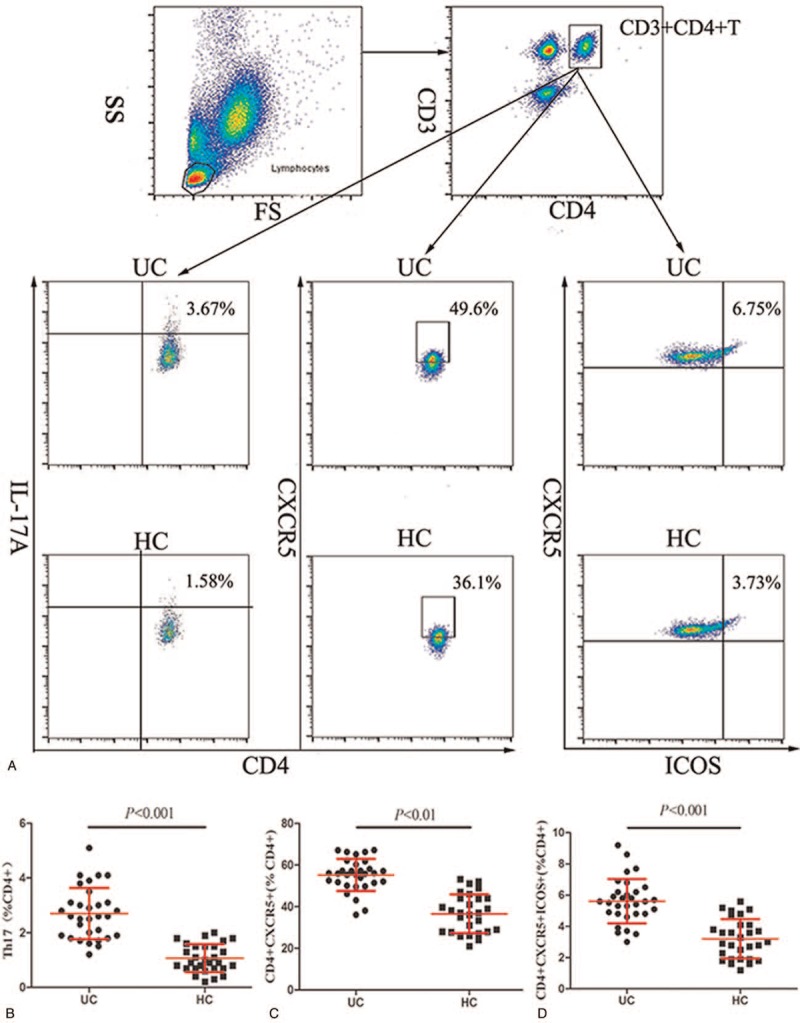
Figure 1.

Flow cytometry analysis of TFH and TH17 cells. (A) Flow cytometry analysis and (B–D) quantitative analysis. Data shown are representative dot plots or are expressed as the mean percentage of B cells of individual subjects. The difference between the two groups was analysed by the Mann–Whitney U nonparametric test. The horizontal lines represent the median values.
