Figure 3.

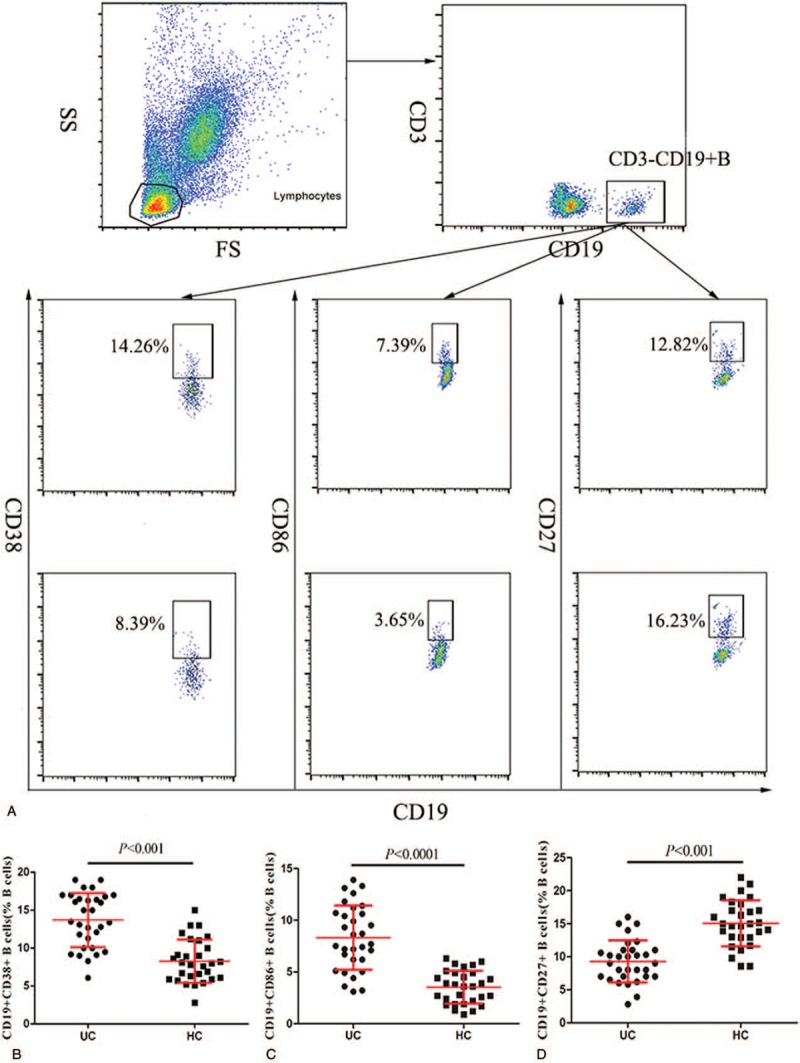
Flow cytometry analysis of B cell subsets. (A) Flow cytometry analysis and (B–D) quantitative analysis. Data shown are representative dot plots or are expressed as the mean percentage of B cells of individual subjects.

Flow cytometry analysis of B cell subsets. (A) Flow cytometry analysis and (B–D) quantitative analysis. Data shown are representative dot plots or are expressed as the mean percentage of B cells of individual subjects.