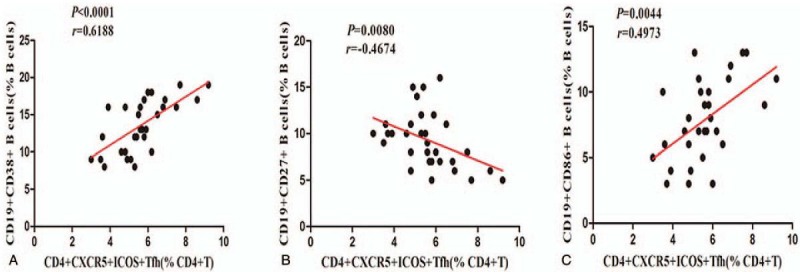
Figure 4.

Correlation analysis between the percentages of TFH cells and B cell subpopulations. (A and C) The percentages of CD38+CD19+B cells and CD86+CD19+B cells were positive correlated with CD4+CXCR5+ICOS+ TFH cells. (B) Negative correlation between the percentages of CD27+CD19+ B cells and CD4+CXCR5+ICOS+TFH cells.
