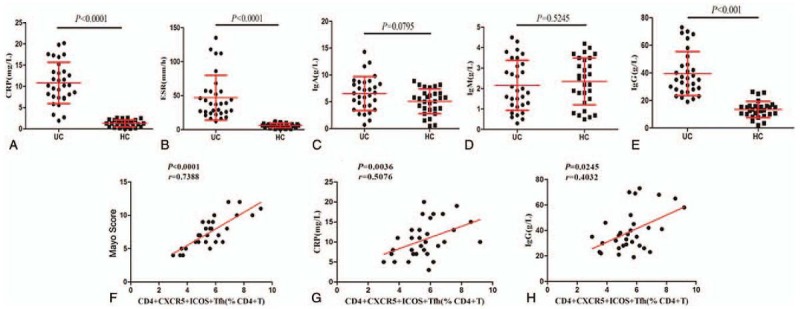
Figure 5.

Comparison of clinical parameters in UC patients versus HCs. TFH cell proportion was significantly correlated with Mayo score and the concentrations of CPR and IgG. (A–E) Quantitative analysis of clinical-pathological features. (F–H) Correlation analysis. The Mayo clinical score and the concentrations of serum CRP and IgG were positively correlated with the percentage of CD4+CXCR5+ICOS+ TFH cells.
