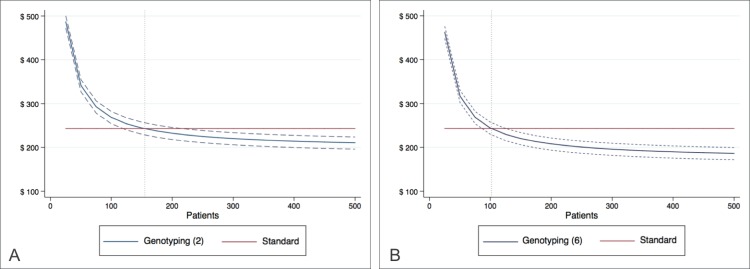
Fig 4. Overall cost per patient.
Graphical representation of overall cost per patient, considering the complete treatment, in the setting of two-sample (A) and six-sample (B) analyzes, and their respective credible intervals. The vertical dotted reference line marks the patient threshold for cost-benefit.

