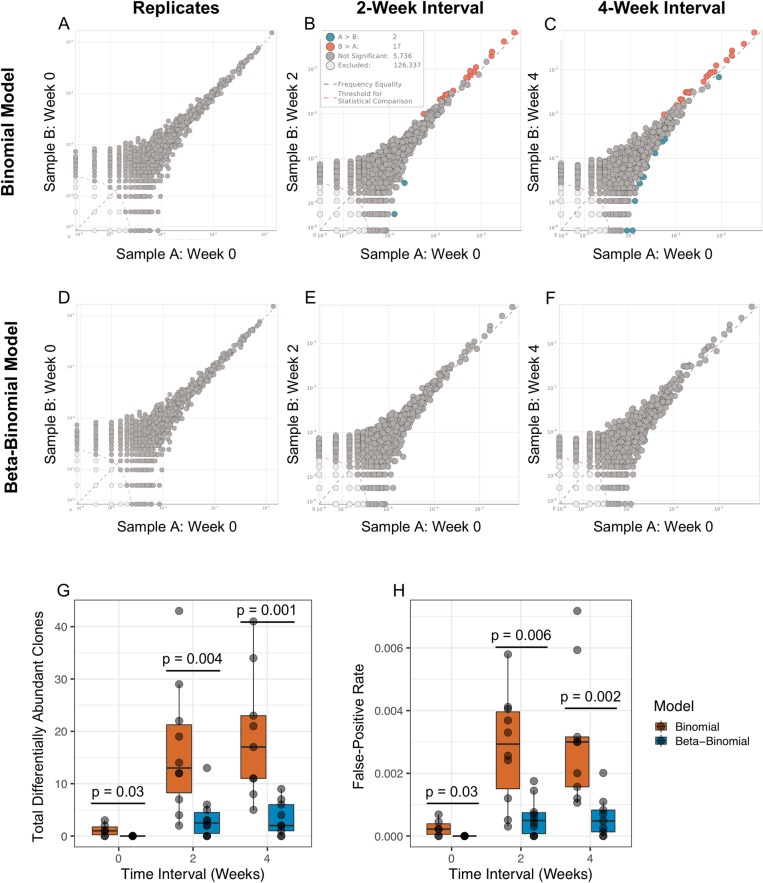
Fig 1. Differential abundance analysis in technical replicates and samples collected over 2-week and 4-week intervals.
Scatter plots of T-cell clone frequencies (from the whole blood of a single donor) in technical replicates as well as samples collected every two weeks over a 4-week period, with differentially abundant clones annotated in orange or cyan as determined by the binomial model (A–C) or the beta-binomial model (D–F). For each time interval, T-cell clones with were tested for differential abundance (dark grey, orange, and cyan) and the remaining clones (light grey) were excluded. Summary of the differential abundance analysis results comparing the performance of the binomial and beta-binomial model in detecting differentially abundant clones (G) and the overall false-positive rate (H). Statistical significance was assessed in G and H by Wilcoxon Rank Sum tests.

