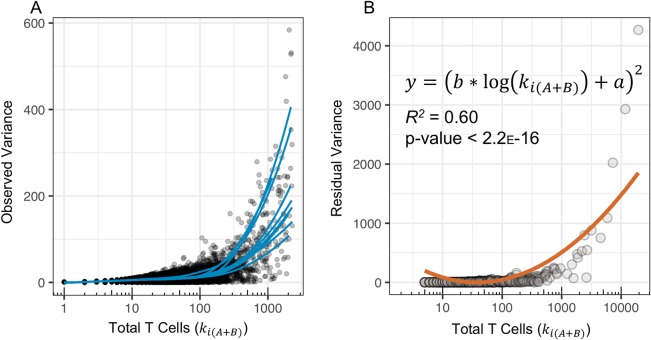
Fig 2. Dispersion parameter as a function of clone frequency in 10 healthy donors at week 2 and at week 4.
(A) The observed variance of |kiA−kiB| plotted for each nt across all ten subjects; blue lines are LOESS curves representing the data trends of each subject. (B) Fit of the modeled residual variance (orange line), defined as (b*log(ki(A+B))+a)2, to the observed residual variance (gray points) in T-cell counts between two samples from one blood donor; observed residual variance was calculated as the absolute difference between the observed variance of |kiA−kiB| and the expected variance due to binomial sampling, which follows the form np(1−p), where n is equal to kiA and p is the frequency of observing a given pair of kiA and kiB for each value of ki(A+B).

