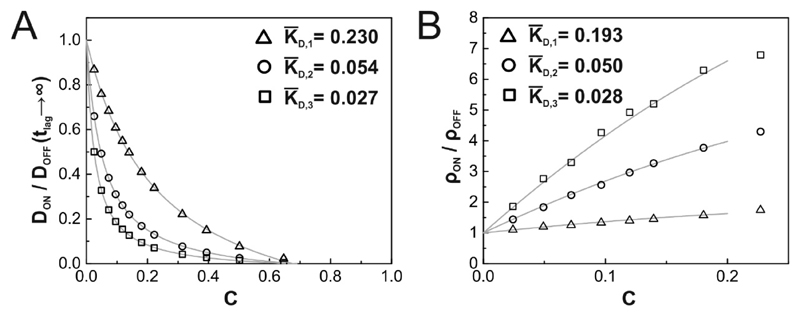
Figure 8. Determination of dissociation constants from tracer diffusion and surface density.
Binding was simulated with a binding probability pbind = 0.1 and three different average binding times of τ1 = 0.025ms (Δ), τ2 = 0.1ms (○), τ3 = 0.2ms (□), which correspond to dissociation constants for τ1, τ2 and τ3, respectively. Mobility ratios DON/DOFF at tlag = 200ms (A) or ρON/ρOFF (B) are plotted as a function of area fraction covered by obstacles. The fits (gray lines; models described in the main text) are in good agreement with simulated data; fit results are provided in the figures.

