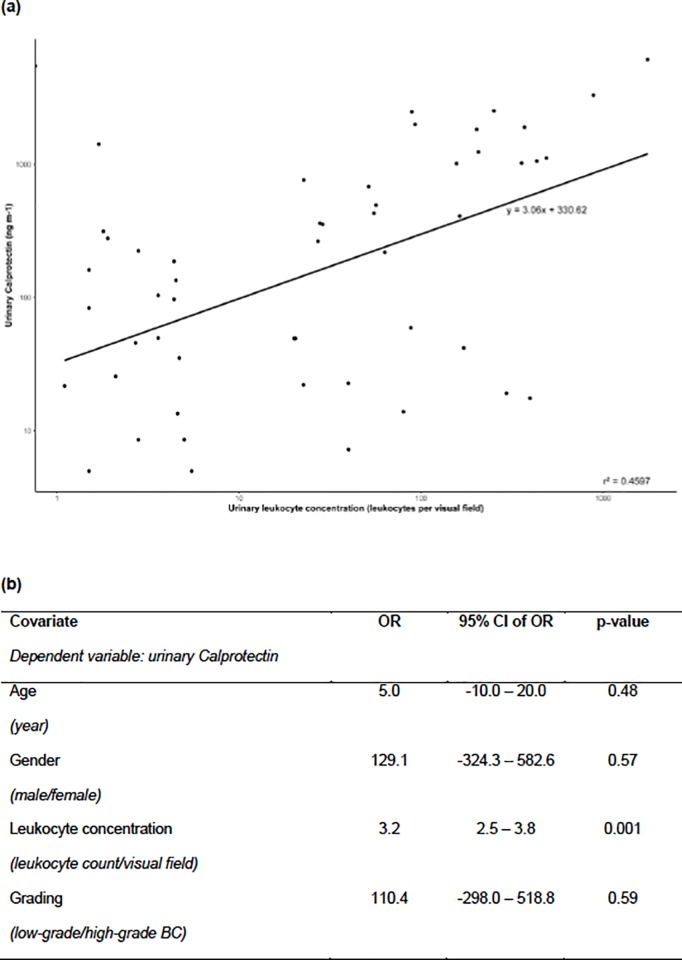
Fig 2. Correlation of urinary Calprotectin (uC) and sterile leukocyturia (SL).
(a) Regression line is plotted. Linear regression model: R = 0.68, B = 3.06, (95% CI 2.12–4.00), p<0.001. Spearman`s correlation: R = 0.4 (95% CI 0.14–0.62), p = 0.001. (b) Multivariant regression analysis identified leukocyte concentration to be the only significant impact factor for uC concentration. B, regression co-efficient, slope of regression line; BC, bladder cancer, CI, confidence interval; OR, odds ratio; R, correlation co-efficient; r2, goodness of fit.

