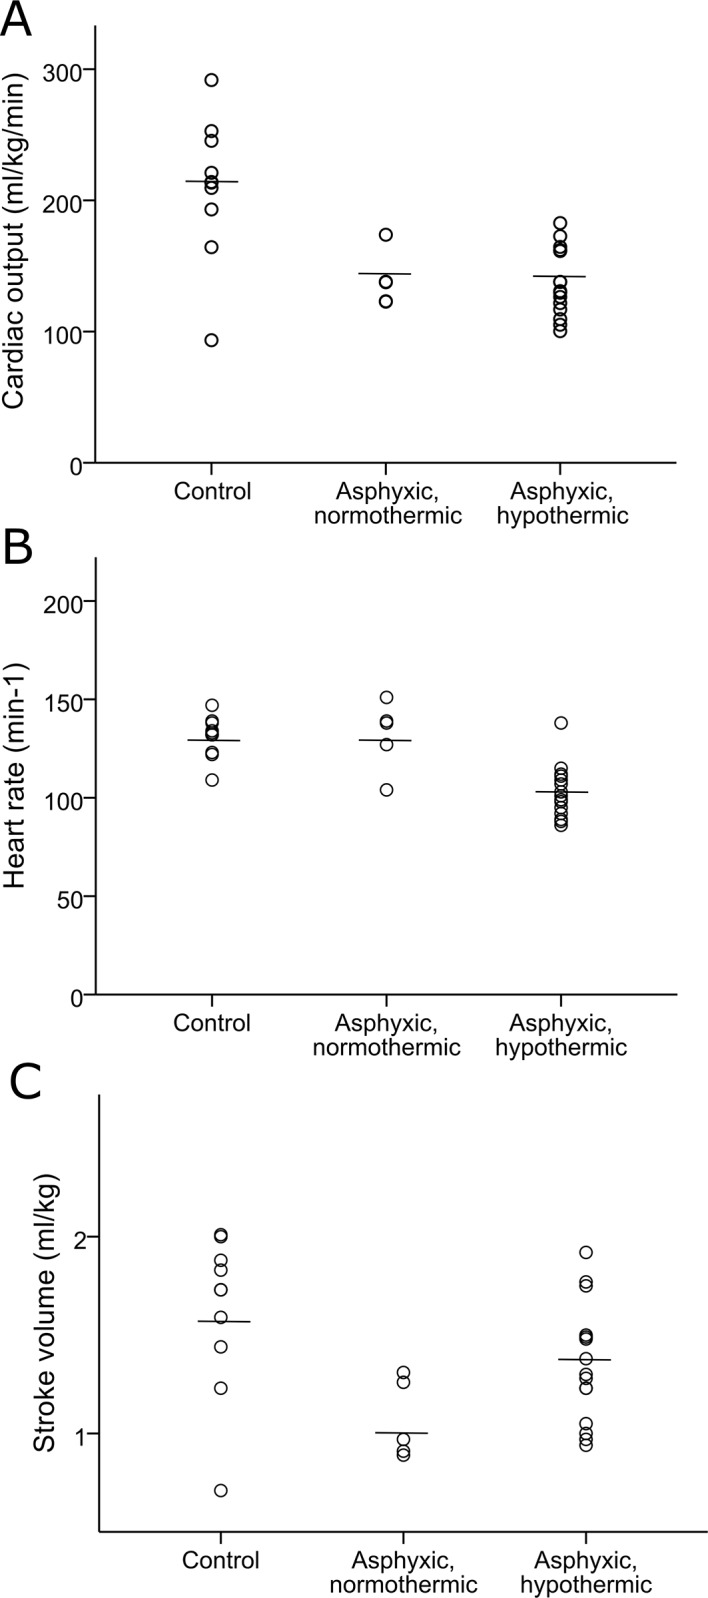
Fig 2.

Comparison of (A) cardiac output, (B) heart rate, and (C) stroke volume between healthy control infants (n = 10) and normothermic asphyxiated infants (n = 5) and hypothermic asphyxiated infants (n = 15). The lines represent mean values.

Comparison of (A) cardiac output, (B) heart rate, and (C) stroke volume between healthy control infants (n = 10) and normothermic asphyxiated infants (n = 5) and hypothermic asphyxiated infants (n = 15). The lines represent mean values.