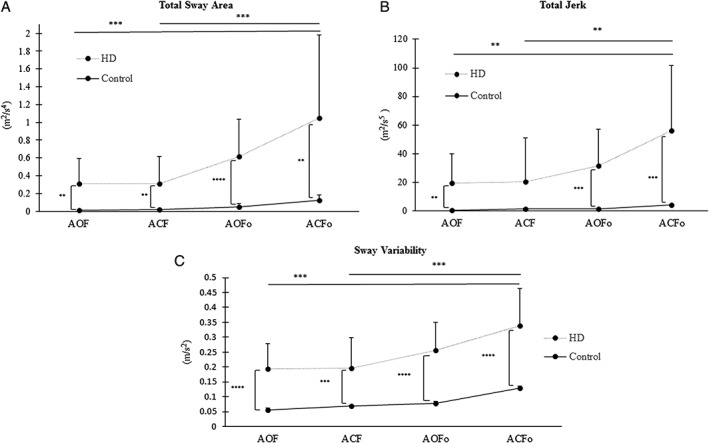
Figure 2.

Within and between group comparisons of (A) total sway area, (B) total jerk, and (C) RMS sway values of the HD and control groups under the four conditions of the (CTSIB‐M) modified clinical test of sensory integration and balance; (AOF) feet apart, eyes open, firm surface feet apart; (ACF) eyes closed, firm surface; (AOFo) feet apart, eyes open, foam surface; and (ACFo) feet apart, eyes closed, foam surface. All values are expressed as mean + SD. **P ≤ 0.01, ***P ≤ 0.001, ****P ≤ 0.0001.
