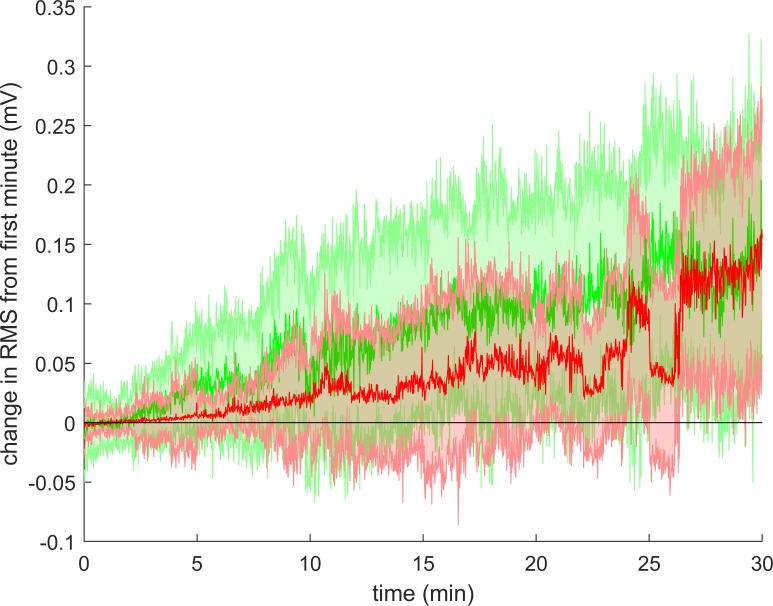
Fig 2. Change in RMS during sitting.
The figure shows the change in average RMS during sitting in cLBP patients (red) and healthy controls (green). Solid line: group median. Shaded area: inter quartile range. Since not all participants could sit for 30 minutes, the number of participants presented in this figure are less at the end than at the beginning.

