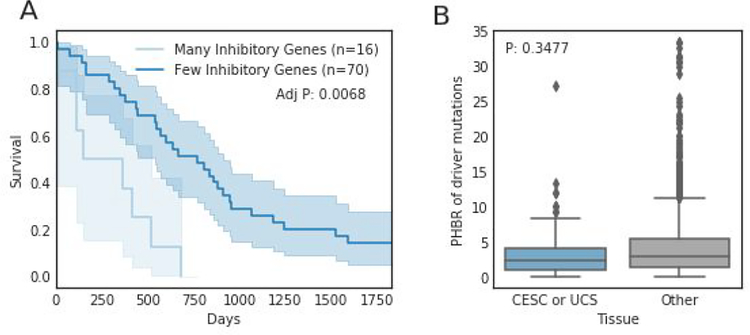
Figure 7.
The impact of KIR copy number on tumor development phenotypes in CESC and UCS. (A) Kaplan-meier survival curves denoting the difference in survival between patients with more inhibitory genes than average and less inhibitory genes than average. (B) A boxplot showing the difference in MHC-I presentation of driver mutations between CESC and UCS.

