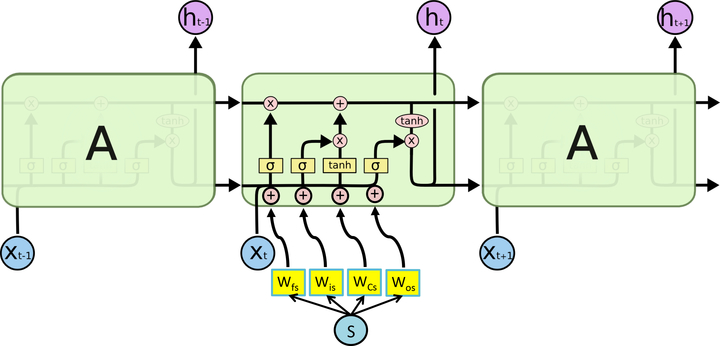
Figure 3:
Hybrid LSTM layer. The structured covariate weights are shown in yellow. A dot product between these parameters, shared across cells and the structured covariates is added to the original input to the LSTM nonlinearities. Within a cell, the symbols + and × in the small circles represent binary operations, while tanh in the oval is the activation applied to the output. The functions in the yellow rectangles, σ, σ, tanh and σ represent the nonlinearities of the LSTM for the forget gait, input gate, state change and output gate respectively. The outputs of the LSTM, ht−1, ht and ht+1, are the learned representations.

