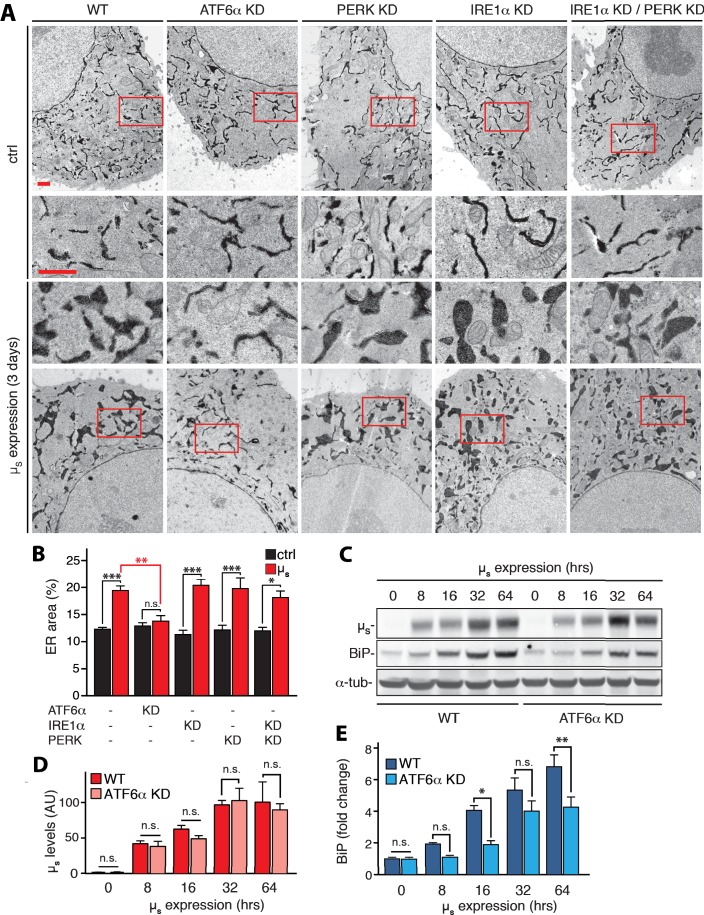
Figure 2. ATF6α is essential but IRE1α and PERK are dispensable for upregulation of ER chaperones and ER expansion in response to µs expression.
(A,B) HeLa-µs cells in which UPR transducers were ablated by silencing alone or in combination, or not (WT), as indicated, were induced with 0.5 nM Mif to express µs for 3 days or not. The cells harbor APEX-KDEL, a modified version of pea peroxidase that is targeted to the ER, and that catalyzes polymerization of 3,3’-diaminobenzidine tetrahydrochloride (DAB) upon treatment with H2O2 to obtain DAB precipitates (dark), revealing the extent of the ER in electron micrographs. Boxed areas are shown by 3-fold magnification; scale bars represent 1 µm (A). The extent of ER expansion was assessed as described (Bakunts et al., 2017), and the percentage of the area within the cytoplasm corresponding to ER was determined and depicted in bar graphs (B). Mean and s.e.m. are shown, n = 10–20. (C–E) Cells were induced to express µs for the indicated times. Levels of µs (D) and BiP (E) were quantitated from (C), and replicate experiments. (D) Levels in WT of µs at 64 hr were set at 100 that was scaled to levels of BiP in WT at 64 hr such as to reflect a ratio of µs to BiP of 2:3, that is an estimate for this ratio at day three based on earlier quantitations that we have described (Bakunts et al., 2017). Mean and s.e.m. are shown in bar graphs; n = 2–5. Statistical significance in the extent of ER areas in the electron micrographs between µs-expressing or non-expressing cells (black), or between µs-expressing WT or ATF6α ablated cells (red) (B), or in expression levels (D,E) was tested by ANOVA (n.s., not significant; *p≤0.05; **p≤0.01; ***p≤0.001).
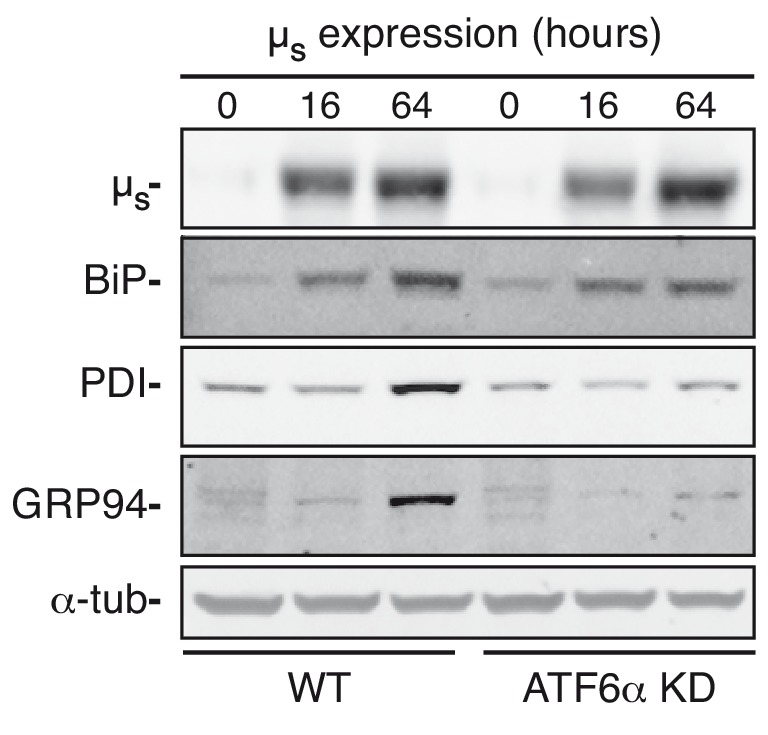
Figure 2—figure supplement 1. ATF6α ablation compromises ER chaperone upregulation upon µs expression.


