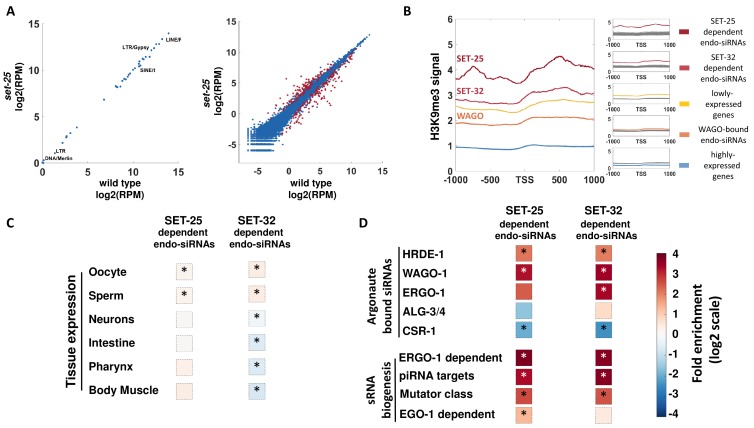
Figure 3. A genome-wide analyses of endo-siRNAs that depend on SET-25 or SET-32.
(A) An expression analysis of endo-siRNAs targeting transposons and repetitive elements classes (left panel) or protein-coding genes (right panel). Shown are the expression values as log2 of number of Reads per Million (RPM) in set-25 mutants (y-axis) compared to wild type animals (x-axis). Gene targets of endo-siRNAs, which display significant differential expression (analyzed with Deseq2, adjusted p-value<0.1) are marked in Red (B) An analysis of H3K9me3 signals (based on published data from McMurchy et al., 2017) on differet sets of gens: highly expressed genes (top 10%, Blue), lowly expressed genes (top 10%, Yellow) and gene targets of endo-siRNAs that depend on SET-25 (based on Lev et al., 2017, Red), SET-32 (based on Kalinava et al., 2018), Dark Red) or endo-siRNAs associated with WAGOs (HRDE-1,WAGO-1, and ERGO-1, Light Red). H3K9me3 signal is aligned according to gene's Transcription Start Sites (TSS), and the regions of 1000 base pairs upstream and downstream of the TSS are shown on the x axis. The y axis shows the averaged signal of the H3K9me3 modification as a function of distance from the TSS. For statistical analysis, control data sets (shown in Gray) were created by sampling the H3K9me3 levels of randomly selected gene sets of the same size as the examined gene list. (C and D) An enrichment analysis of genes with significantly lowered levels of endo-siRNAs targeting them in set-25 and set-32 mutants compared to wild type. Fold enrichment values (log2 scale) are color coded. (C) An enrichment analysis for expression in specific tissues. (D) An enrichment analysis for different small RNA pathways. The p-values were calculated using 10,000 random gene sets identical in their size to the examined endo-siRNA-target gene list. Asterisk denotes statistically significant enrichment values (p-value<0.05).


