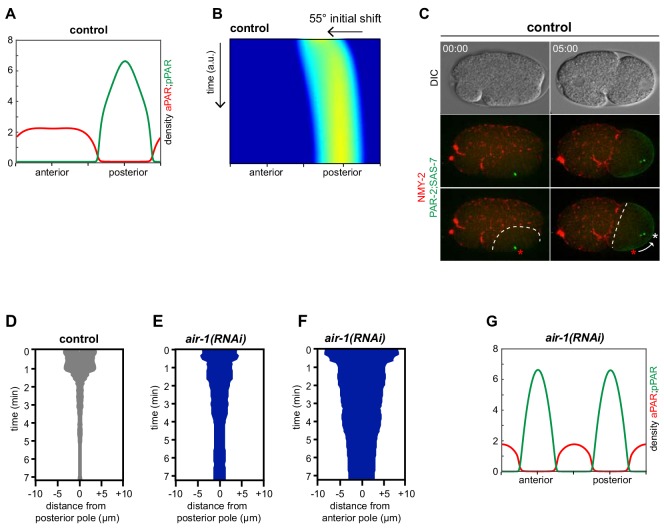
(
A) Numerical simulation of cortical distributions of anterior (red) and posterior (green) PAR proteins distribution dynamics in control embryos. (
B) Simulation kymograph of PAR-2 distribution in control embryos, mimicking an experiment in which all densities are shifted 55°C away from the posterior pole after polarity establishment (
Mittasch et al., 2018). Note correction of the PAR-2 domain over time towards the posterior pole. Parameters: α/l = 1.2 and β τ⁄(ρP0)=100. (
C) Control embryo expressing RFP::NMY-2 (red), as well as GFP::PAR-2 and GFP::SAS-7 (both green) exemplifying a symmetry breaking event away from the posterior pole (t = 00:00), as evidenced by NMY-2 clearing, followed by correction of the PAR-2 domain to the posterior pole (t = 05:00, arrow indicates centrosome trajectory). (
D–F) Standard deviation of the distance from the pole (0 on the X axis) to the center of the PAR-2 domain (posterior or anterior, as indicated) over time (t = 0 corresponds to the initiation of the PAR-2 domain) in randomly selected control and
air-1(RNAi) embryos (N = 15 each). Note that the offset of the PAR-2 initiation site did not differ in control and
air-1(RNAi) embryos on the posterior side, whereas it arose with a larger offset on the anterior side, possibly because of invaginations resulting from the polar body extrusion that give rise to pronounced membrane curvatures. (
G) Numerical simulation of cortical distributions of anterior (red) and posterior (green) PAR proteins distribution dynamics in
air-1(RNAi) embryos.


