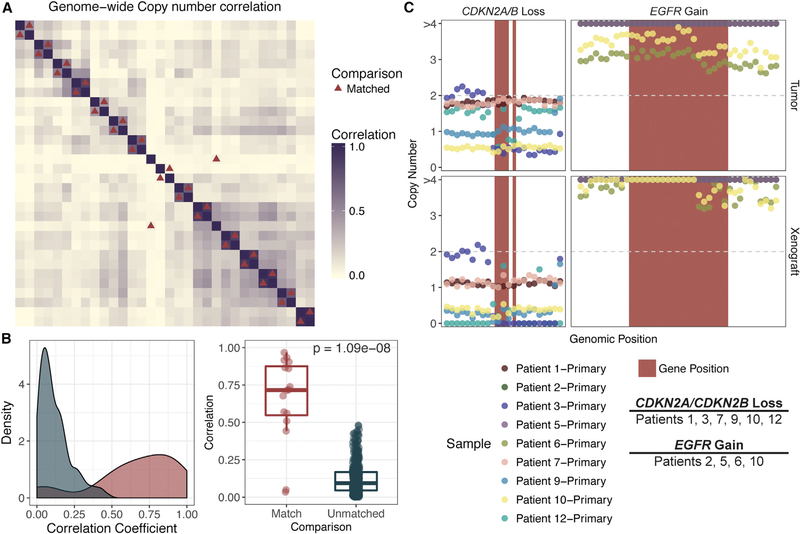
Figure 2. Copy-Number Alterations Are Concordant in Matched PDXs and Tumors.
(A) Correlation matrix displaying the Pearson correlation coefficient (calculated on the basis of the absolute copy-number segment mean across 10 kb windows). Samples are sorted on the basis of unsupervised hierarchical clustering of the correlation coefficient. Red triangles correspond to matched tumors and PDXs.
(B). Density plot showing differences in correlation coefficient between case-matched tumors and PDXs (red) versus any other comparison (blue). A Wilcoxon test was performed, comparing the correlation between case-matched PDXs and unmatched or distinct pairs of samples (p = 1.09e-08).
(C) Genes commonly altered at the copy-number level in HNSCC were analyzed with 100 kb windows on either ends of the gene. Red rectangles correspond to the genomic positions of the indicated gene. Point color corresponds to sample. Copy number is indicated by absolute copy number on the y axis, and only segments with median copy number > 3 or < 1.5 are indicated by color (according to sample source).
Refer to Figure S2 for further details.

