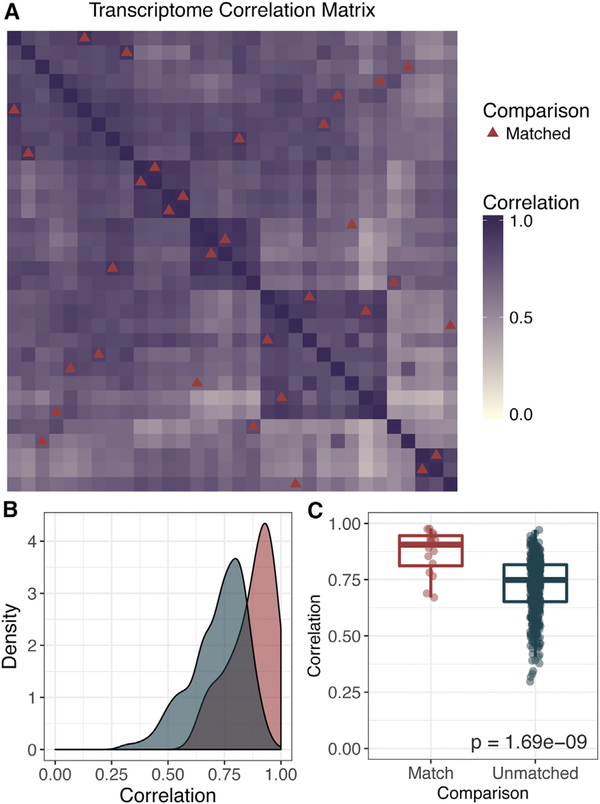
Figure 4. Correlation across the Transcriptome Is Highest in Matched Tumors and PDXs.
(A) Correlation matrix displaying the Pearson correlation coefficient calculated across the gene expression of 59,884 genes (FPKM). This included the whole transcriptome with the exception of the top 1% of genes contributing to the principal components in Figure 3. Red triangles indicate tiles corresponding to case-matched tumors and PDXs.
(B) Density plot showing differences in correlation coefficient between case-matched tumors and PDXs (red) versus any other comparison (blue).
(C) A Wilcoxon test was used to compare the correlation between case-matched PDXs and unmatched or distinct pairs of samples.

