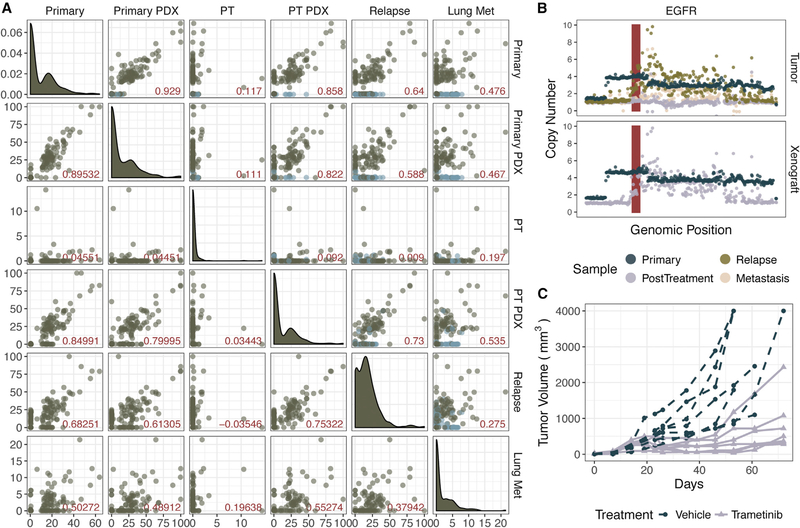
Figure 6. Patient 2 PDX Parallels Clinical Response in a Trametinib “Co-clinical” Trial.
(A) Variant allele frequency (VAF) of the y axis labels (right-hand side) and the x axis labels (across top) are indicated by each point. The upper triangle contains all variants, either detected in the primary tumor (dark blue) or detected in a subsequent sample (green). The lower triangle contains only variants detected in the primary tumor. Pearson correlation coefficient is indicated by the red value in the lower right-hand corner of each plot. Density plots along the diagonal indicate the VAF density in the corresponding sample.
(B) Absolute copy number is plotted along the y axis. Each point corresponds to the segment mean calculated across 10 kb (per sample) windows within the shown genomic coordinates. The EGFR locus is shown in red.
(C) Tumor growth comparison between vehicle-treated and trametinib-treated P2 xenografts.

