
Figure 2:
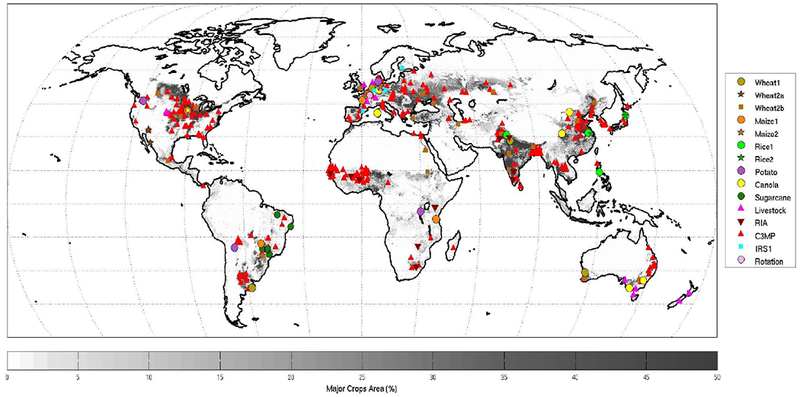
Map of sites and networks for agricultural impacts studies exploring responses to [CO2], temperature, water, nitrogen, and/or adaptation, and major crops area (%) by Monfreda et al. (2007); note that studies cover many major production regions, while GGCMI activities simulate the entire land surface.