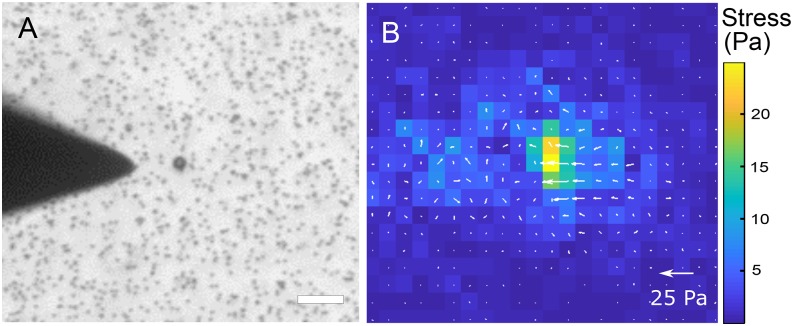
FIG. 2.
(A) Phase image of the magnetic probe tip near a 4.5 μm magnetic bead bound to a PAA gel. The micro-beads in the PAA gel are also visible. Scale bar is 20 μm. (B) Heat map and vector plot of traction forces exerted on the PAA gel due to the magnetic probe – magnetic bead interaction. Scale bar for the vectors is indicated and that for the heat map is on the right. Note: If the top surface of the substrate is the x-y plane, the indicated stress vectors involve stress components τzx and τzy.

