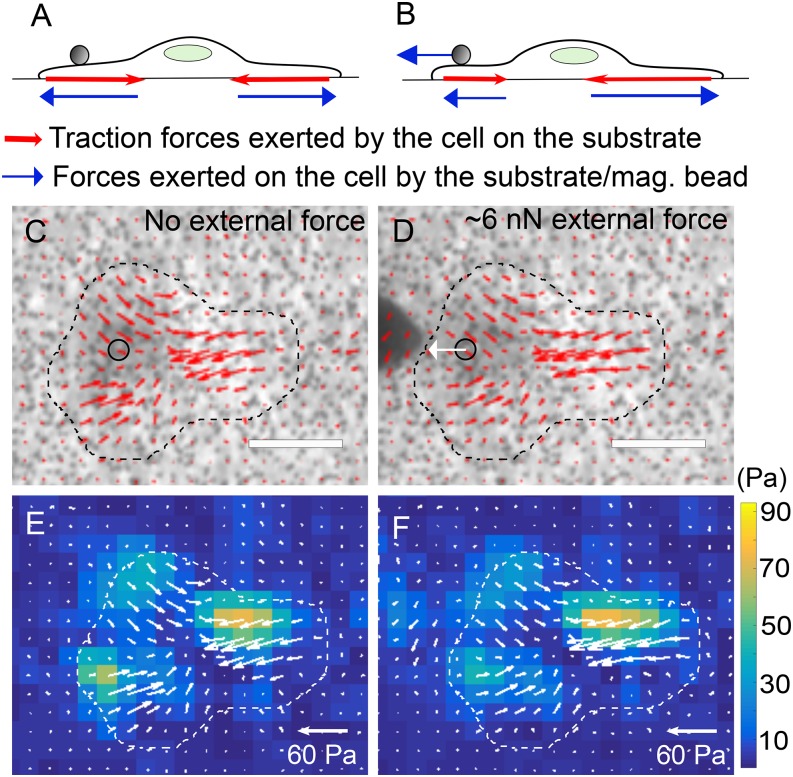
FIG. 4.
(A, B) Schematic depiction of a cell that is adherent on a substrate, with a magnetic bead attached to it. Traction forces (red) exerted by the cell on the substrate as well as the forces (blue) exerted by the substrate/magnetic bead on the cell are depicted when (A) no external forces are applied on the cell and (B) an external force is applied on the cell via the magnetic bead. (C, D) Phase images of an MDCK cell with a col1-coated 4.5 μm magnetic bead attached to it with (C) no external force and (D) an external force of ∼6 nN applied to it via the magnetic bead. Traction stress vectors (for the traction exerted by the cell on the substrate beneath) are superimposed. Scale bar corresponds to 20 μm. (E, F) Heat map images of the traction stress with superimposed traction stress vectors (white) corresponding to that in (C, D). Heat map scale for traction stress is shown on the right.

