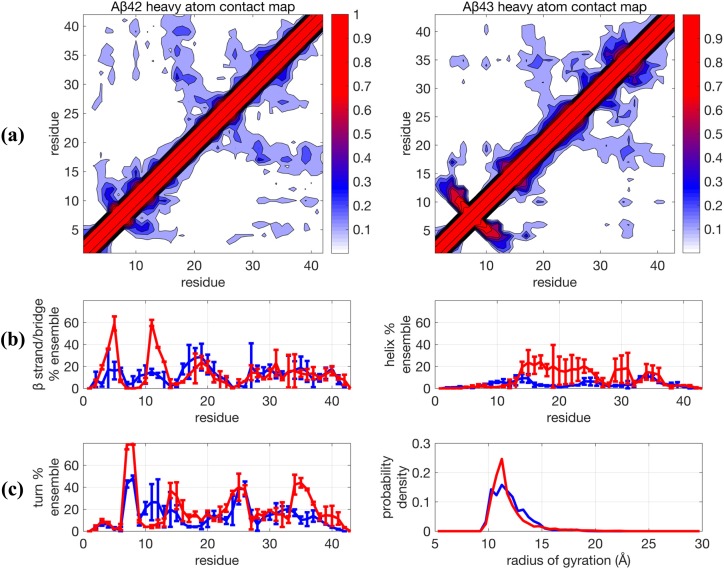
FIG. 1.
Comparison of structural properties for Aβ42 and Aβ43 using the force field Amber99SB + TIP4P-Ew and using TREx simulated at 0.1 µs/replica. (a) Contact maps, (b) β−strand and helix propensities, and (c) turn propensity and radius of gyration distribution. For (b) and (c), blue lines are for Aβ42 and red lines are Aβ43 and represent the average for two independent trajectories. Error bars are plus and minus one standard deviation of the calculated propensity at the given residue for the two trajectories and generally represent the degree of agreement between the two trajectories.

