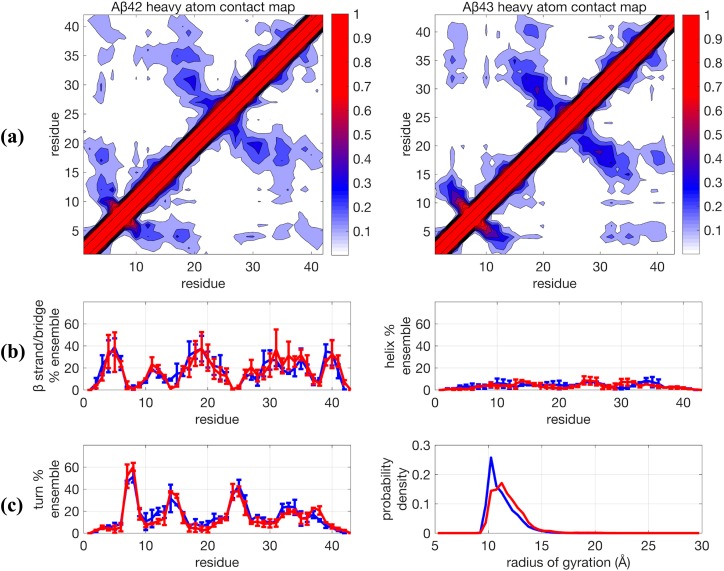
FIG. 2.
Comparison of structural properties for Aβ42 and Aβ43 using the force field Amberff99sb + TIP4P-Ew and using Temperature Replica Exchange (TREx) simulated at 0.8 µs/replica. (a) Contact maps, (b) β−strand and helix propensities, and (c) turn propensity and radius of gyration distribution. For (b) and (c), blue lines are Aβ42 and red lines are Aβ43. Further details are given in the caption of Fig. 1.

