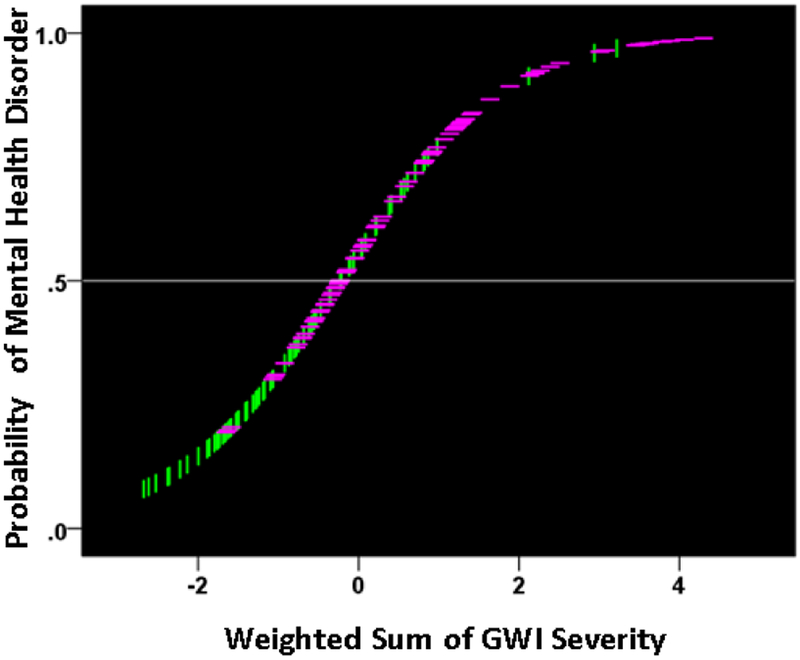
Figure 8:
The probability of presence of mental health disorder is plotted against the weighted sum of the 6 GWI severity, where the weights are the coefficients provided by the logistic regression. (see text for details.) Vertical green lines indicate participants without mental health problems; horizontal magenta lines indicate participants with mental health problems.

