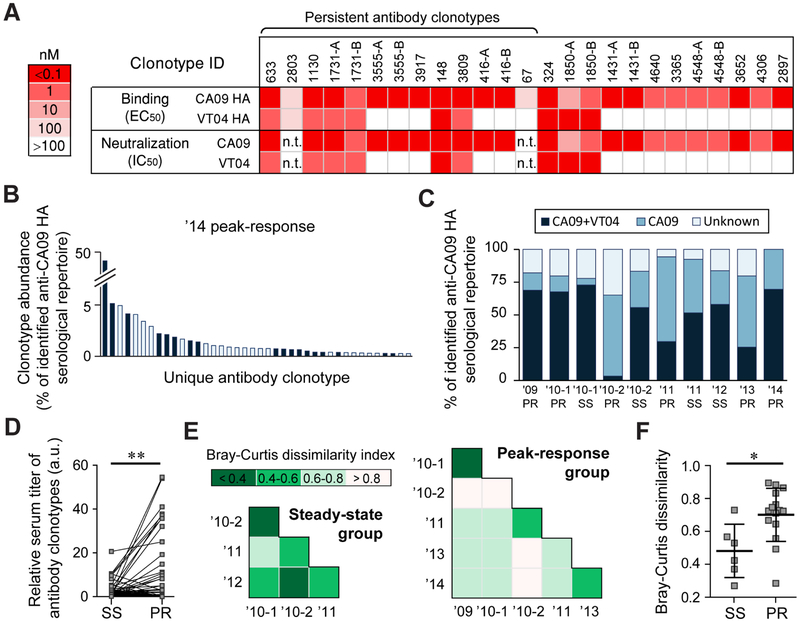
Fig. 2. Serum antibody binding specificities and repertoire similarities across time points.
A. Binding and neutralization activities of a panel of 25 recombinantly expressed serum antibodies. (representing 19 serum antibody clonotypes) (see also Table S4). ELISA was performed using recombinantly expressed HAs from H1N1 A/California/7/2009 (CA09) and H5N1 A/Vietnam/1203/2004 (VT04) influenza virus strains while the neutralization activities were measured using CA09 and VT04 pseudoviruses. In some case, two somatic variants from the same clonotypes were analyzed and denoted as A and B. n.t., not tested. B. The ’14 peak response serum antibody repertoire to CA09 HA with antibody clonotypes also detected in the affinity chromatography eluate with VT04 HA (see also Table S2) shown in dark blue. C. Fraction of the repertoire comprising of CA09+VT04 or CA09-selective antibody clonotypes. Antibodies for which the binding specificity was not determined are shown as ‘unknown’ (see also Fig. S3). D. Relative amount of the 24 persistent antibody clonotypes before and after vaccination. For three vaccinations (’10-1, ’11 and ’13), sera were collected both at before and after immunizations. Each data point pair corresponds to the amount (calculated as % abundance of individual antibody clonotype multiplied by serum titer at that time point) of each 24 persistent antibody clonotypes at steady-state (SS) and at peak-response (PR). Statistical significances were determined using the paired t test. a.u., arbitrary units. E. Pairwise Bray-Curtis dissimilarity analysis among repertoires from the steady-state serum samples (left) or peak-response serum samples (right). Lower indices indicate higher similarity between the samples. F. Pairwise Bray-Curtis dissimilarity indices among steady-state (SS) and peak-response (PR) serum samples; error-bars show s.d. (n = 6 and 15) (see also Fig. S4). Statistical significance by Mann-Whitney U test. For D and F, * p<0.05; ** p<0.01.

