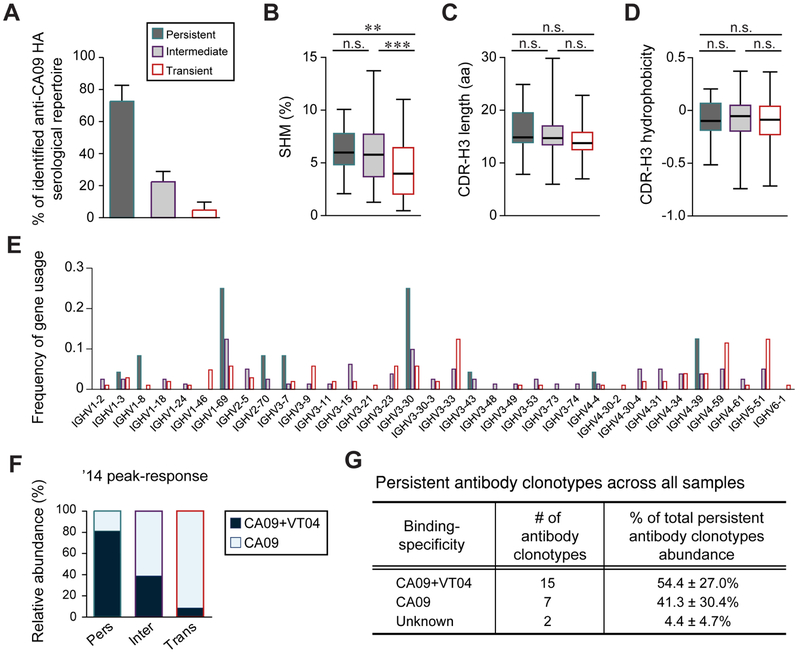
Fig. 3. Characterization of persistent, intermediate and transient antibody clonotypes (see also Table S2).
A. Average fraction of persistent, intermediate and transient antibody clonotypes as fraction of the serological repertoire. B-D. IGHV somatic hypermutation mutation (SHM) rates (B), CDR-H3 length (C), and CDR-H3 hydrophobicity (Eisenberg index) (D) are shown where boxes extend from the 25th to 75th percentiles with the whiskers indicating min to max. Statistical significance was determined using the Mann-Whitney U test (** p<0.01; *** p<0.001). E. Frequency of gene usage. F. Relative abundance of CA09+VT04 and CA09-selective antibody clonotypes in the ’14 peak-response sample for each temporal dynamic group. G. Relative abundance of CA09+VT04 and CA09-selective persistent antibody clonotypes. Unknown, binding specificity not determined.

