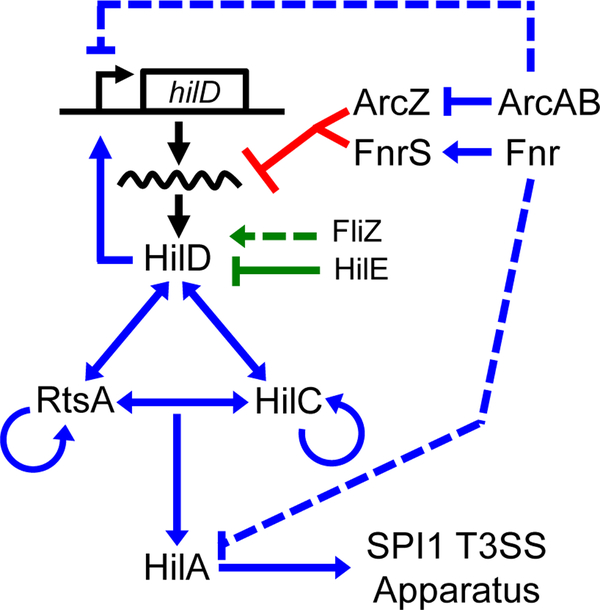
Figure 1. Simplified model of the SPI1 T3SS regulatory circuit.
Blue lines indicate transcriptional regulation, green lines indicate regulation of HilD at the protein level, and red lines indicate regulation of hilD translation. Dotted lines indicate that the exact mechanism of regulation is not known and is likely indirect.

