
Figure 1.
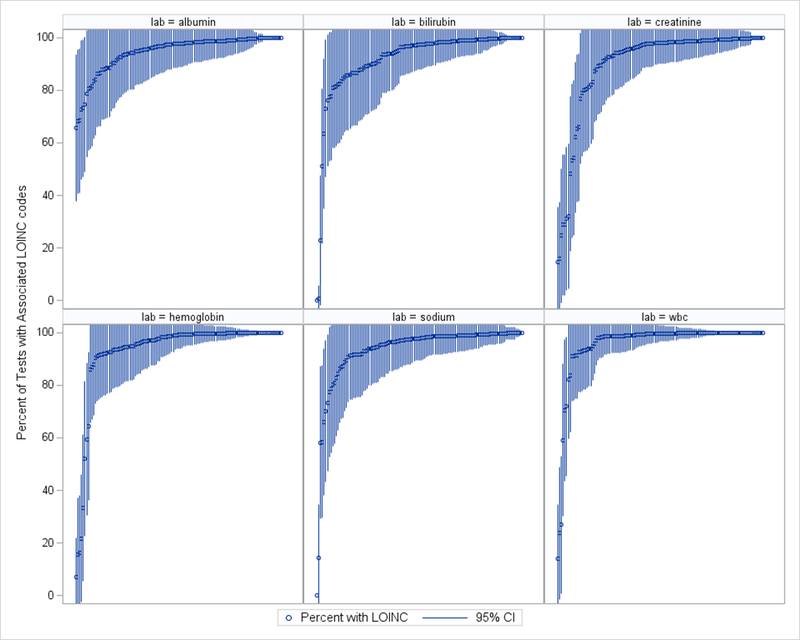
Distribution of the percent of tests with an associated LOINC for N=5,454,411 acute hospitalizations among VA hospitals from 2005 – 2015. Each line represents a VA hospital, the circle represents the average proportion across years of laboratory tests associated with a correct LOINC for that test at that site, the lines represent the 95% Confidence Interval.