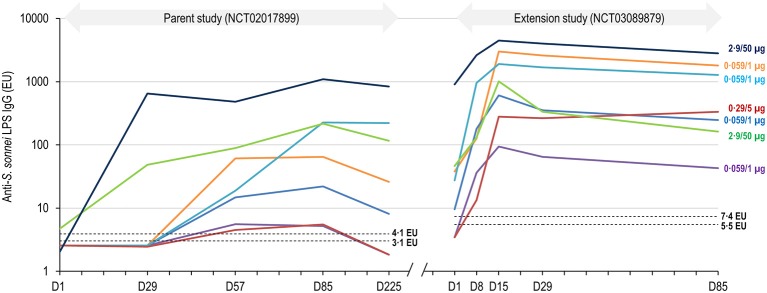
Figure 5.
Individual anti-S. sonnei LPS IgG responses of participants in the boosted group throughout the parent and extension studies. LPS, lipopolysaccharide; IgG, immunoglobulin G; EU, enzyme-linked immunosorbent assay units; D, day. The interval from D225 in the parent study and D1 in the extension study is not represented to scale. Dashed lines represent the limit of detection of the enzyme-linked immunosorbent assay, which varied from plate to plate, from 3·1 to 4·1 EU in the parent study (17) and from 5·5 to 7·4 EU in the extension study.

