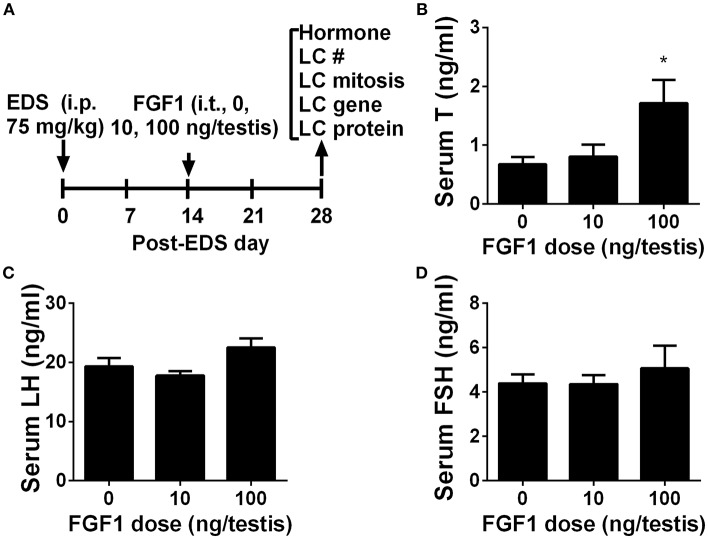
Figure 1.
Serum testosterone, LH, and FSH levels after in vivo FGF1 treatment (A) Scheme of the animal experiment of intratesticularly injecting (i.t.) 0, 10, and 100 ng/testis FGF1 on post-EDS day 14 for 14 days; EDS, ethane dimethane sulfonate; LC, Leydig cell; i.p., intraperitoneal injection; (B) Serum testosterone (T) levels; (C) LH levels; (D) FSH levels. Mean ± SEM, n = 6. Asterisk (*) designates significant difference at P < 0.05 when compared to the control (0 ng/testis FGF1).

