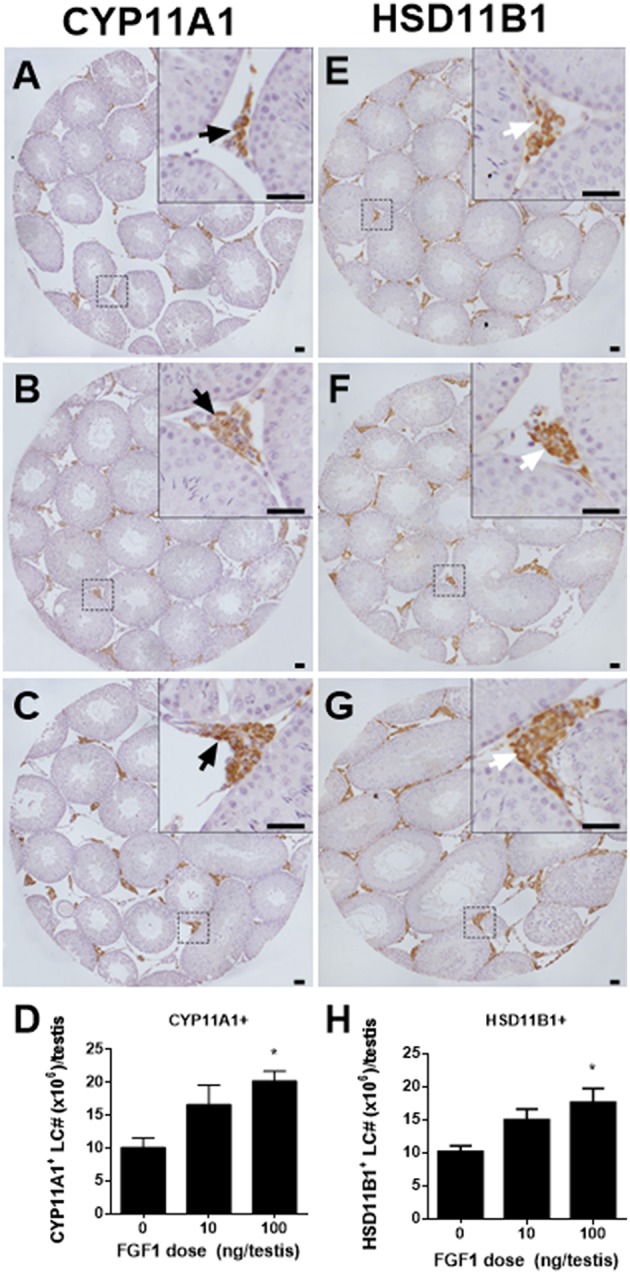
Figure 2.

Morphology and cell number of Leydig cells after in vivo FGF1 treatment. Immunohistochemical staining of CYP11A1 (A–C) and HSD11B1 (E–G) of the testes from the rats treated with 0, 10, and 100 ng/testis FGF1 on post-EDS day 14 for 14 days. (A,E) the control (0 ng/testis FGF1); (B,F) 10 ng/testis FGF1; (C,G): 100 ng/testis FGF1; (D,H) quantitative data. Black arrow designates CYP11A1 positive Leydig cells. White arrow designates HSD11B1 positive Leydig cells. Bar = 50 μm. Mean ± SEM, n = 6. Asterisk (*) designates significant difference at P < 0.05 when compared to the control (0 ng/testis FGF1).
