Figure 9.
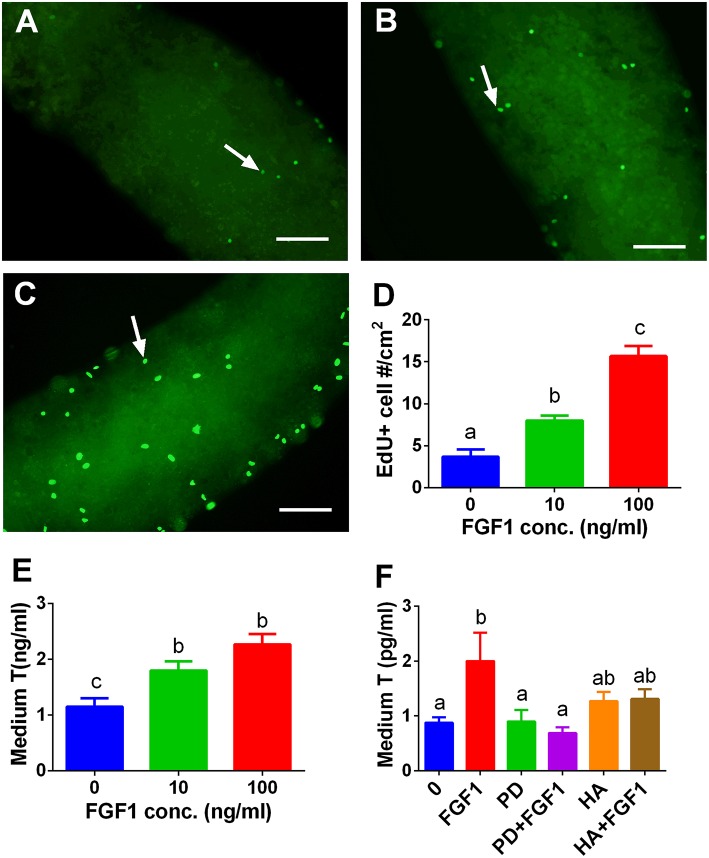
EdU incorporation into stem Leydig cells and indirect measurement of medium testosterone (T) levels after FGF1 treatment in vitro. Immunofluorescent staining of EdU (green color in the nucleus) of stem Leydig cells on the surface of the seminiferous tubules treated with 0 (A), 10 (B), and 100 ng/ml FGF1 (C) for 7 days; (D): quantitative data of percentage of EdU-positive cells per cm2, Mean ± SEM, n = 3. White arrow designates EdU-positive stem Leydig cells. Bar = 50 μm. (E,F), medium testosterone (T) levels after the seminiferous tubules were treated initially by FGF1 and/or 1 μM PD173074 (PD) and/or 1 μg/ml heparin (HA) for 7 days and then the tubules were switched in LCDM for additional 2 weeks. Mean ± SEM, n = 6. Identical letters designate no significant differences at P < 0.05 between two groups.

