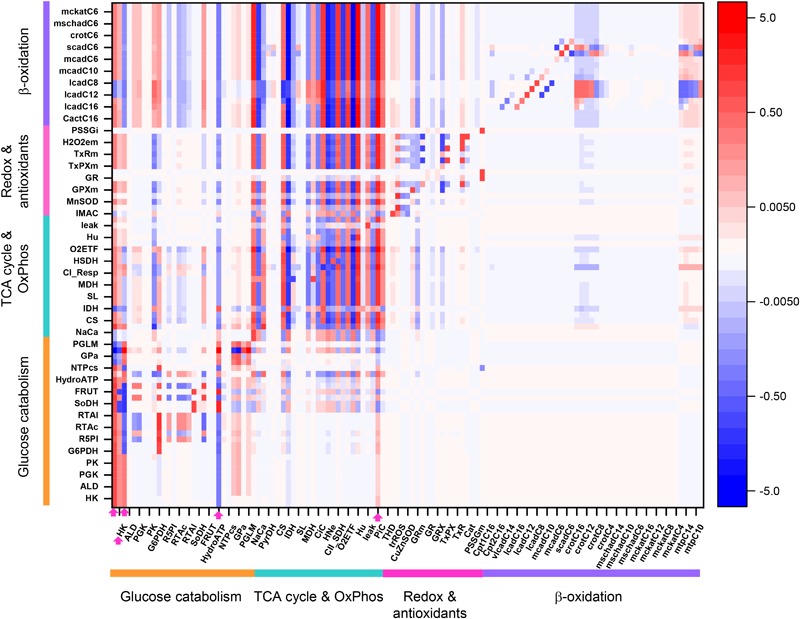
FIGURE 3.

Overview heat map of flux control coefficients in the catabolic network fueled by Glc and PCoA. The values of the flux control coefficients exerted by individual enzymes/transport processes over metabolic reaction steps in the catabolic network present in the x- and y-axes, respectively, can be positive (red) or negative (blue) as depicted by the color scale on the right. Only steps for which the sum of the control coefficients falls within the range 0.5 – 2.0 are included (i.e., the summation theorem of MCA states that the sum of flux control coefficients should equal 1.0). The key to the fluxes and activities is indicated in Table 1. For visualization, the block of cytoplasmic (mainly glucose catabolism), mitochondrial (TCA cycle and Oxphos), redox and antioxidant reactions, and lipid oxidation, are indicated by colored bars. The order of the reactions will be the same for all heat maps presented in this work. Although, for clarity, only one out of two reaction labels are displayed in the x-axis, the control coefficients with respect to each one of the activities participating in the model are shown in the heat map. The heat map displayed was obtained from the MCA applied to the steady state simulation at 10 mM Glc and 10 μM PCoA (i.e., convergence point between Glc or PCoA variable condition shown in Figure 2A). Magenta arrows point to main rate-controlling steps of the flux. The numerical values of the flux control coefficients are shown in Supplementary Table S21.
