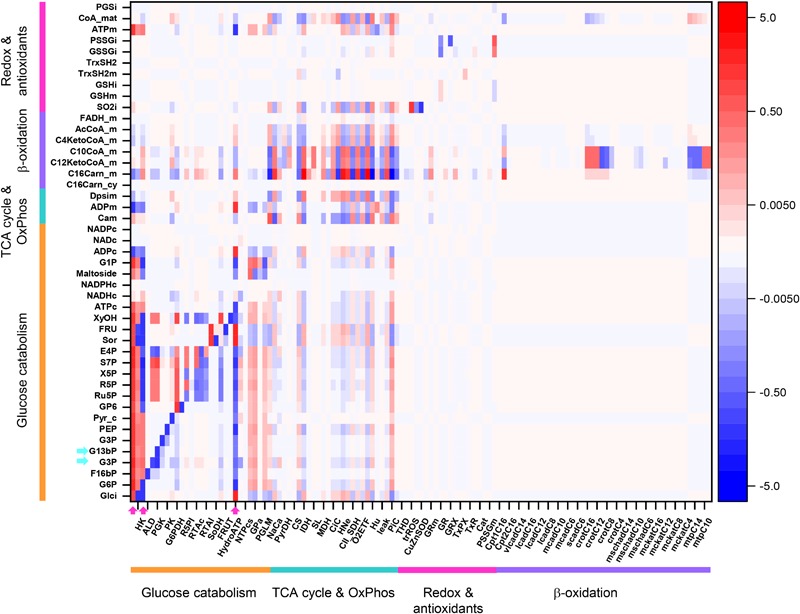
FIGURE 8.

Overview heat map of metabolite control coefficients in the catabolic network of glucose and PCoA oxidation pathways. The control of metabolite concentrations (in y-axis) at 10 mM Glc and 10 μM PCoA (see also Figure 3 heat map for flux control coefficients) is represented as a function of the activity of the individual enzymes that catalyze metabolic reactions in the network (in x-axis). The value of metabolite concentration control coefficients is denoted by the intensity of red (positive control coefficient) or blue (negative control coefficient) as indicated by the color scale on the right. The key to the flux and activity labels is displayed in Table 1. Only metabolites for which the sum of the control coefficients equals less than 0.1 or -0.1 are included (i.e., the summation theorem of MCA states that the sum of concentration control coefficients for metabolites should equal 0). For visualization, the block of cytoplasmic (mainly glucose catabolism), mitochondrial (TCA cycle and OxPhos), redox and antioxidant reactions, and lipid oxidation, are indicated by colored bars. The order of the reactions is the same in all heat maps that have been presented in this work, e.g., Figure 3–5. For clarity, only one label out of two reactions is shown in the x-axis. However, the metabolite concentration control coefficients with respect to each one of the activities participating in the model are depicted in the heat map. Cyan arrows on the y-axis point to metabolites mentioned in the main text as examples, and arrows on the x-axis point out main rate-controlling steps of the flux (see also Figure 2). Dpsim stands for mitochondrial membrane potential, Δψm. The numerical values of the metabolite concentration control coefficients are shown in Supplementary Table S24.
