FIGURE 5.
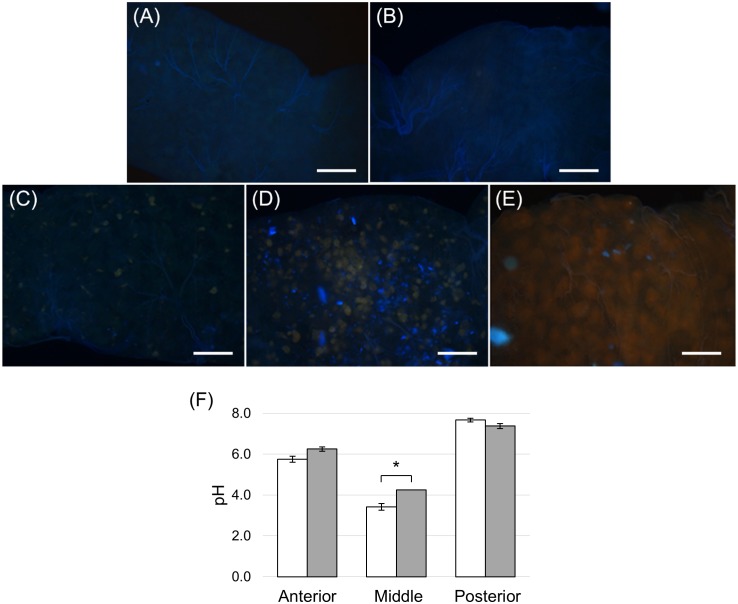
Copper feeding experiments. (A) Dissected midgut from control larvae reared on standard diet without CuCl2 for 24 h. (B–E): dissected midgut from larvae reared on standard diet added with CuCl2 for 6, 14, 24 and 48 h, respectively. (F) pH measurement of midgut juice samples from anterior, middle, and posterior regions of the midgut isolated from larvae fed for 24 h on control (white bar chart) and copper-containing diet (gray bar chart). The values are reported as mean ± SEM of at least 3 experiments. Only in the middle midgut a significant difference between groups was observed (unpaired t-test: ∗p < 0.01). Bars: 100 μm (A–E).

