FIGURE 8.
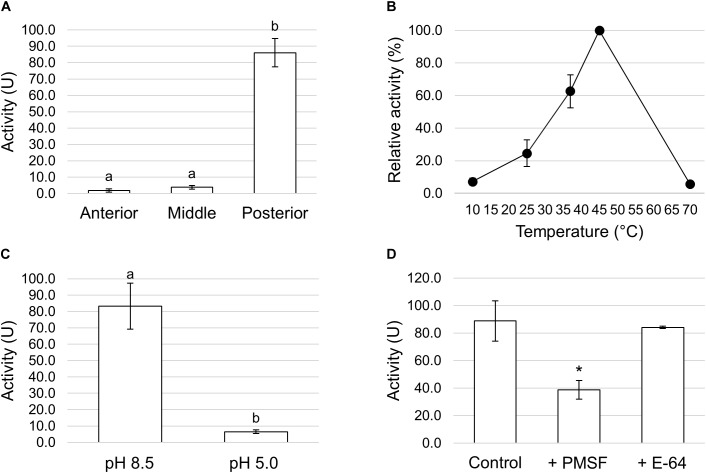
Total proteolytic activity in the different midgut regions. (A) Total proteolytic activity in midgut juice extracted from anterior, middle, and posterior midgut. For each tract the enzymatic assay was performed at a pH value as close as possible to that of the lumen (pH 6.0 for the AMG, pH 5.0 for the middle midgut, and pH 8.5 for posterior midgut). The values are reported as mean ± SEM of at least 3 experiments. Different letters denote significant differences (ANOVA test followed by Tukey’s test. ANOVA p-value < 0.001, Tukey’s test p-values: Middle vs. Anterior p = 0.975, Posterior vs. Anterior p < 0.001, Posterior vs. Middle p < 0.001). (B) Dependence of total proteolytic activity on temperature in midgut juice from the posterior region of the midgut performed at pH 8.5. Relative activity values (%) are reported as mean ± SEM of at least 3 experiments and are expressed as percentage of the highest activity over the temperature range examined. (C) Total proteolytic activity in midgut juice from the posterior midgut measured at pH 8.5 and 5.0. The values are reported as mean ± SEM of 3 experiments. Different letters denote significant differences (paired t-test: p-value < 0.05). (D) Total proteolytic activity in midgut juice from the posterior midgut measured at pH 8.5 in the absence (control) and in the presence of serine- (PMSF) and cysteine- (E-64) protease inhibitors. The values are reported as mean ± SEM of 5 experiments. A significant difference between groups was observed for the activity measured in the presence of PMSF vs. control (paired t-test: ∗p-value < 0.01).

